-
Notifications
You must be signed in to change notification settings - Fork 0
Developer manual
Tools for importing data from a sensor directly on the istSOS server. istSOS is a python based server for maintaining sensor observation services.
On istSOS you can manage and dispatch your sensor data with graphical user interface or through python scripts. istSOS works as a storage of your data as well as a medium for visualizing or analyzes.
What does mean SOS? It's Sensor Observation Service, an internation OGC format standard for providing sensor observation data and even for some operations with them.
SOS standard has very special vocabulary. So let's explain how the SOS vocabulary can be translated into real life in NINA:
- Service = Type of logger device (Temperatur logger, Moisture logger... )
- Offering = Grouping unit for procedures (e.g. Project)
- Procedure = Individual sensor or other individual device writing measurements
Some additional sources for further server configuration / optimization:
- implementation of an istSOS proxy
What you need and what shall you have installed before you start your work with istSOS?
A python based server for maintaining sensor observation services. On istSOS you can manage and dispatch your sensor data with graphical user interface or through python scripts.
See the project documentation here[1].
Object-relational database management system working with a database server.
See the project documentation here[2].
PostgreSQL support for geographic data.
See the project documentation here[3].
Graphical user interface for PostgreSQL.
See the project documentation here[4].
Server providing HTTP services.
See the project documentation here[5].
Python WSGI (interface between web server software and web applications) module for Apache.
See the project documentation here[6].
Python interface for PostgreSQL.
See the project documentation here[7].
Manuals are written for Linux OS.
Your data are expected to come in some format and architecture. If you think your format should be also supported and you cannot retype your data into supported format, please feel free to open an issue for that.
service
│
└───service offering location
│   └───procedure
│       │   INDEX.SWD
│       │   SD201701.SWD
│       │   SD201702.SWD
│       │   ...
│
└───service offering location
    └───procedure
        │   INDEX.SWD
        │   SD201701.SWD
        │   SD201702.SWD
        │   ...
or just
service offering location
└───procedure
        │   INDEX.SWD
        │   SD201701.SWD
        │   SD201702.SWD
        │   ...
NOTE: If your location is more than one word, please divide them with spaces or minuses.
NOTE: The name SD2017.SWD is not required. It is required only to hold this structure of data archiving.
service
│
└───offering
    └───folders-by-years
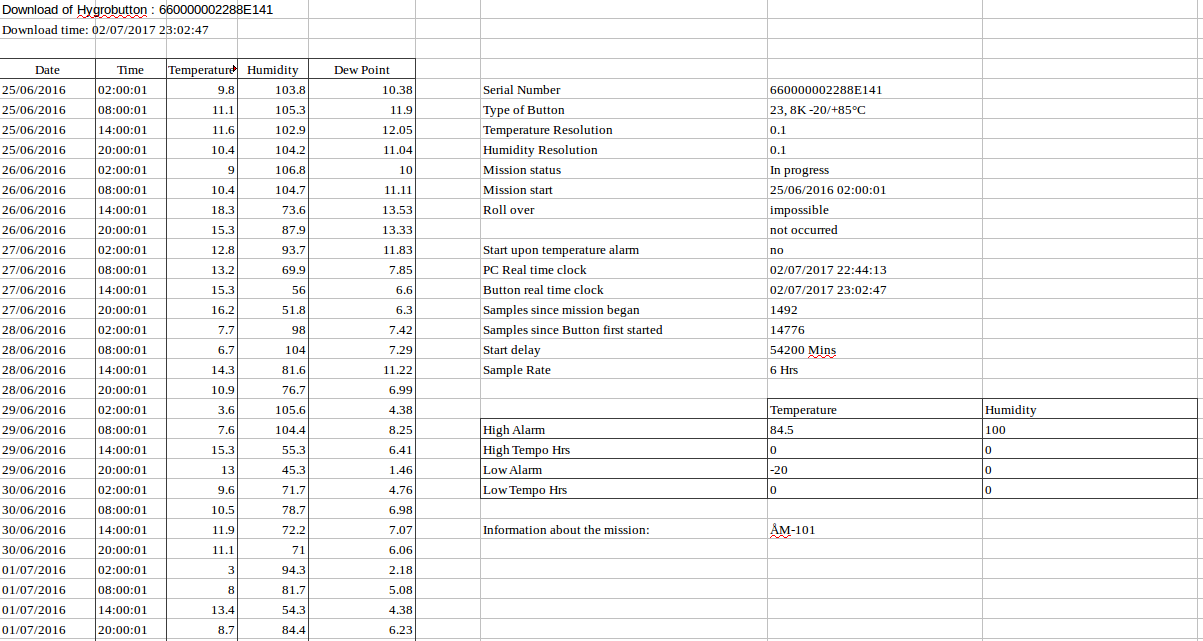
│       │   PROCEDURE.xls
│       │   PROCEDURE.xls
│       │   PROCEDURE.xls
│       │   ...
│
└───offering
    └───folders-by-years
        │   PROCEDURE.xls
        │   PROCEDURE.xls
        │   ...
NOTE: If your location is more than one word, please divide them with spaces or minuses.
NOTE: The name of file in format PROCEDURE.xls is required.
T2	Temperature (*F)	RH (%)
	*F	%
	TMP	HMD
2011-11-01 01:31	38,5	109,9
2011-11-01 03:31	39,4	109,4
2011-11-01 05:31	39,4	109,9
2011-11-01 07:31	40,5	109,9
NOTE: The first mark (T2) is a name of the procedure (must correspond with a folder name where it is located).
NOTE: You can use dot or commas as a decimal point.
NOTE: Tabulators are used as delimiters.

If using templogger device, your data should contain also INDEX.SWD. The
contain of this file should look similar to this:
SIGN ObservedPropertyName (unit of measuring)
For example:
TMP Temperature (*F)
HMD RH (%)
To use these tools, you have to clone this repository to your machine, it means make a copy of this repository on your local computer.
It can be done by one simple command ran from your desired folder:
git clone https://github.com/NINAnor/istSOS-support.git
Go to the new directory istSOS-support. Mostly:
cd istSOS-support
Then you can run freely all the scripts from this place.
Because procedures are located somewhere in the field, you have to provide the geometry index file connecting procedures names with their coordinates and crs.
This geometry index file can be automatically created using script. It converts your GPX file into the accesable CSV. If your CSV already exists, this script will update it with procedures that were not imported yet.
You can do it by running this script with your own parameters (instead of asterisks):
python insert2geometryindex.py -gpx_path=* -index_file=*
NOTE: This script should be run in python 3, because it uses some special libraries.
TIP: Need help? Don't know what these parameters mean? No problem, just run this command:python procedures2istsos.py --help
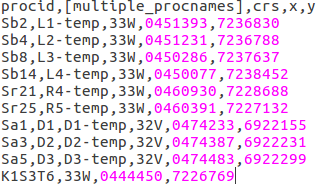
If you are not using the GPX format, you have to create this CSV manually.
Here is an example if the structure:

NOTE: For data mostly used in NINA, you don't have to modify these files. For TOV and Templogger sensors, these geometry files are provided.
Before you start your data loading, you have to make your server prepared for them. It means that you need some server, some service(s) on that server, some offering(s) in those services and procedure(s) in those offerings.
You have to do it manually in the web interface (or most of that). The best way is to follow the official istSOS manual[8]. Or it is at least the best way until you get to the procedures registration, because this step can be done in much faster way using automatized python scripts.
For procedures registration with procedures2istsos, you have to have prepare
an geometry index file for procedures and procedures themselves. One geometry
index file template prepared for NINA templogger service can be found
here in the repository.
Then, you just have to run the script with your own parameters (instead of asterisks):
python procedures2istsos.py -path=* -device_type=* -url=* -service=* --help
TIP: Need help? Don't know what these parameters mean? No problem, just run this command:
python procedures2istsos.py --helpNOTE: In case your service is restricted, you have to define also parameters-username=* -password=*
Run python script with your own parameters (instead of asterisks):
python data2istsos.py -path=* -device_type=* -url=* -service=* -u -f
This command will upload all observations in your path to corresponding procedures on your server.
If you got messages saying > Insert observation success: True, your
data were imported and everything was OK.
TIP: Need help? Don't know what these parameters mean? No problem, just run this command:
python data2istsos.py --help
NOTE: A.datfiles were created as intermediates in your file directories and they were deleted. If you wish to preserve them, don't use-fflag.
NOTE: In case your service is restricted, you have to define also parameters-username=* -password=*
Firstly, you have to convert your observations into .dat files. Simply run
this python script with your own parameters (instead of asterisks):
python convert2dat.py -path=* -file_extension=* -timestamp_column=* -timestamp_format=* -d
NOTE: If you are using
temploggerdevice, you should use-tflag
If there is no warning message, your data were converted into istSOS
acceptable format in .dat file in the same directory as your original file
was.
Now go to the istSOS directory. Mostly:
cd /usr/share/istsos/
Run python script with your own parameters (instead of asterisks):
python scripts/csv2istsos.py -u * -s * -o * -p * -w * -m *
If you got message saying > Insert observation success: True, your
data were imported and everything was OK.
NOTE: A
.datfile(s) was (were) created in your file directory. If you wish to delete it, you have to do it yourself.
NOTE: This method can parse only one directory, without subdirectories. To save time, it is recommended to use the first way.
TIP: Need help? Don't know what these parameters mean? No problem, just run one of these commands:python convert2dat.py --helporpython scripts/csv2istsos.py --help
You can just store them. Or you can do some analyzes above them. How? And which analyzes?
sos4R allows to fetch data of interest from a Sensor Observation Service as a "data frame" directly into an R session.
Note: Many thanks to Daniel Nüst from University of Münster for making sos4R work for us with quick fixes in the client code
In R you can of course apply all thinkable functions on the data and further automatize data utilisation.
As an inspiration and starting point for specific R scrips see the R code below.
install.packages("devtools")
devtools::install_github("52North/sos4R", ref = "dev")
install.packages('lubridate')
library(sos4R)
library('lubridate')

### Connect to server
mySOS <- SOS(url = "http://istsos.org/istsos/demo", binding = "KVP")
### Have to further update the script to work with NINA demo:
# mySOS <- SOS(url = "http://ninistsoso1/istsos/demo", binding = "KVP")

### For SOS servers with limited access one has to provide username and password like this
# mySOS <- SOS(url = "http://ninsrv16/istsos/tovvegetation", binding = "KVP", , curlOptions = list(userpwd = "user:password"))


## Get Server configuration
getObsFormat <- sosResponseFormats(mySOS)$GetObservation[[1]]
getObsFormat
descSensFormat <- sosResponseFormats(mySOS)$DescribeSensor[[1]]
descSensFormat

# sosResponseFormats(mySOS)$DescribeSensor returns NULL


## Find offering of interest
offer <- summary(sosOfferings(mySOS)[[4]])
# Boundig box is NULL, see: https://github.com/istSOS/istsos2/issues/21
offer

## Get list of contained procedures / sensors
proc <- sosProcedures(obj = mySOS)[[4]]
proc

# Get information about procedure (sensor)
mySensor <- describeSensor(sos = mySOS
                           , procedure = sosProcedures(obj = mySOS)[[4]]
                           , outputFormat = 'text%2Fxml%3Bsubtype%3D"sensorML%2F1.0.1"'
                           , verbose=TRUE
                           )
# Gives currently a warning

# Create time period
tPeriod <- sosCreateEventTimeList(
time = sosCreateTimePeriod(
sos = mySOS,
begin = as.POSIXlt('2014-5-1 00:00:00'),
end = as.POSIXlt('2014-12-4 00:00:00')))

# Get observations
observation <- sosResult(getObservation(sos = mySOS
, observedProperty = sosObservedProperties(mySOS)[[4]]
, offering = sosOfferings(mySOS)[[4]]
, procedure = sosProcedures(mySOS)[[4]]
#, srsName = '4326'
, responseFormat = getObsFormat
, eventTime = tPeriod
, verbose = TRUE
))

# Summarize result
summary(observation)

# Plot raw data
plot(observation)

# Plot observed property aggreated by Day of the Year
plot(aggregate(air.rainfall ~ yday(Time), observation, FUN = sum), xlab='', ylab='Precipitation')

# Plot observed property aggregated by Date
plot(aggregate(air.rainfall ~ as.Date(Time), observation, FUN = sum), xlab='', ylab='Precipitation')

# Plot observed property aggregated by Day
plot(aggregate(air.rainfall ~ day(Time), observation, FUN = sum), xlab='', ylab='Precipitation')

# Plot observed property aggregated by Week
plot(aggregate(air.rainfall ~ week(Time), observation, FUN = sum), xlab='', ylab='Precipitation')
# Add lines to plot
lines(aggregate(air.rainfall ~ week(Time), observation, FUN = sum), xlab='', ylab='Precipitation')

# Plot observed property aggregated by month
plot(aggregate(air.rainfall ~ month(Time), observation, FUN = sum), xlab='', ylab='Precipitation')
You can visualize your data on the istSOS server in the form of charts or maps using the data viewer[9]. You can also visualize them with more advanced approach - adjust maps according to your needs following this manual[10] or you can get modify observations like here[11].
Everything offer also aggregations and other data management.
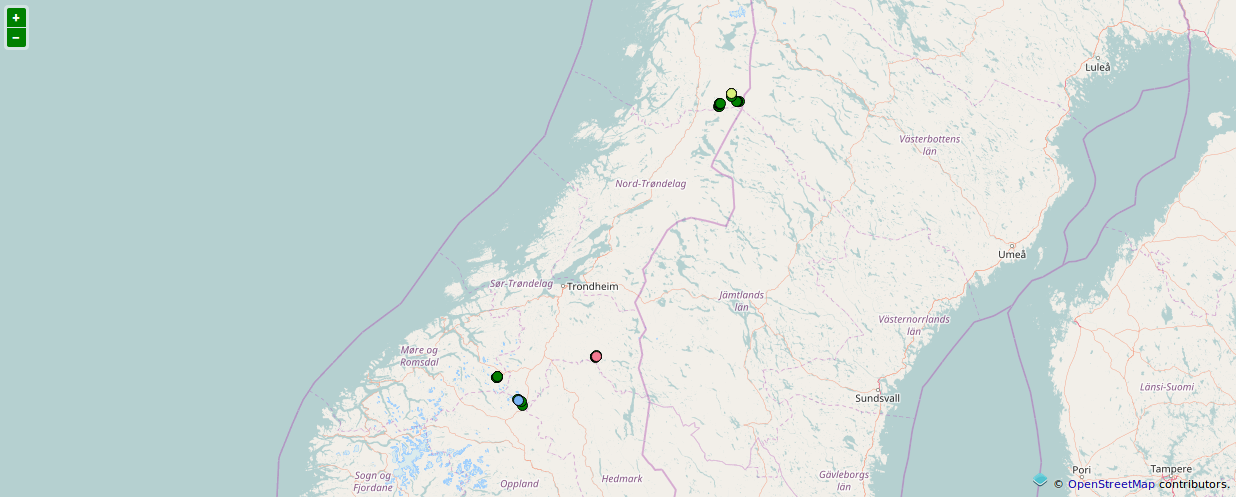
Procedures overview in a map:

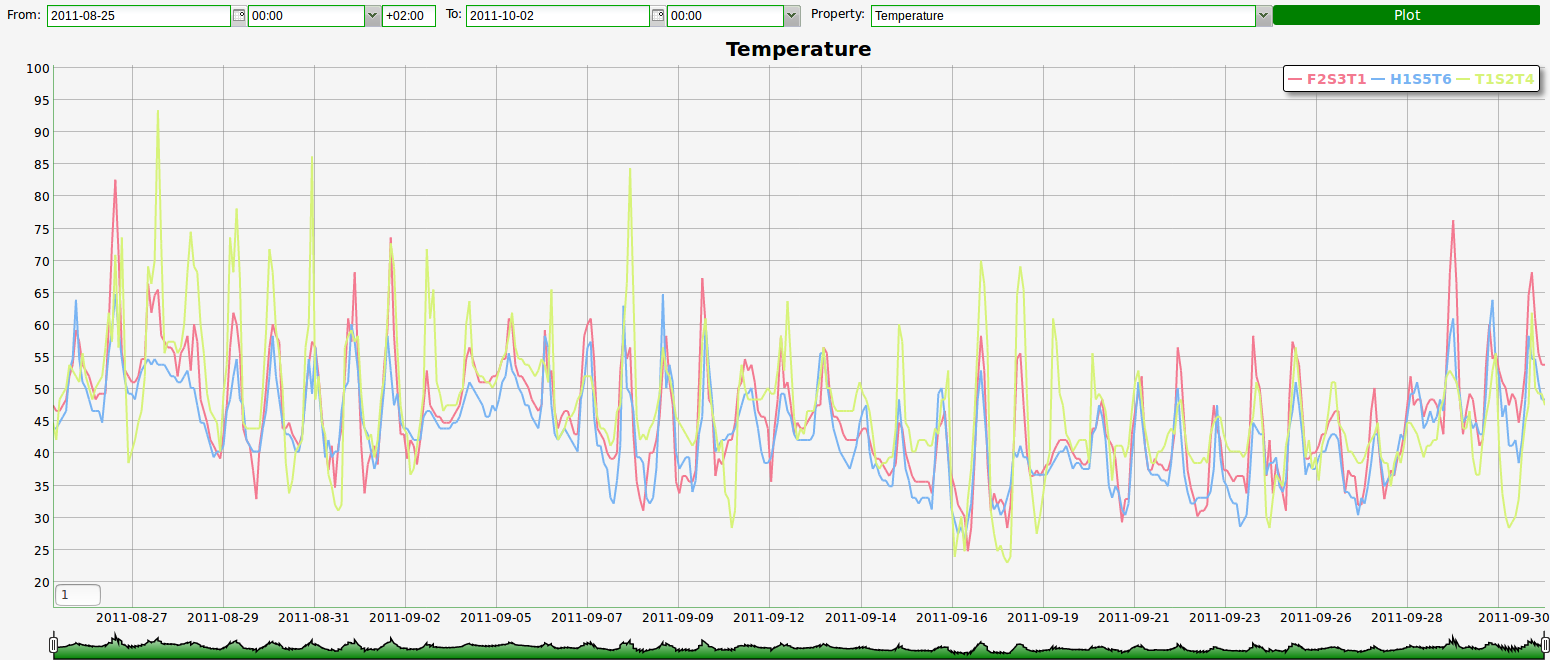
Visualization of selected procedures in a chart:

And in a chart for selected time range:

Yes, handling everything online is really cool. But sometimes you need more sophisticated tools, more specific environment, more and more things. In these cases, there is also a possibility to use GRASS GIS.
Firstly, you must extract data from your istSOS server and import them into GRASS GIS. So start GRASS GIS. Then you can import data directly from istSOS right now in four ways using AddOns from this repository[12].
Import an offering as a vector map with layer for each observed property:
v.in.sos url=* output=* offering=*
Import an offering as a set of raster maps for each timestamp:
r.in.sos url=* output=* offering=*
Import an offering as spatio temporal vector dataset for each observed property:
t.vect.in.sos url=* output=* offering=*
Import an offering as spatio temporal raster dataset for each observed property:
t.rast.in.sos url=* output=* offering=*
All these AddOns have of course their own helps by typing command:
*.in.sos --help
If no error occurs, your data were successfully imported into GRASS GIS. You can do whatever GRASS GIS allows you to do with them (even convert them into other format and work with them for example in QGIS).
Still not sure how to use it? Or do you just want to see some example? No problem, just visit the example page.
[1] http://istsos.org/en/latest/doc/
[2] https://www.postgresql.org/docs/
[3] http://postgis.net/documentation/
[4] https://www.pgadmin.org/docs/
[5] https://httpd.apache.org/docs/
[6] https://packages.debian.org/wheezy/libapache2-mod-wsgi
[7] http://initd.org/psycopg/docs/
[8] http://istsos.org/en/latest/doc/services.html
[9] http://istsos.org/en/latest/doc/getobs.html#using-the-data-viewer
[10] http://istsos.org/en/latest/doc/mapping.html
[11] http://istsos.org/en/latest/doc/getobs.html
[12] http://github.com/pesekon2/GRASS-GIS-SOS-tools