All data and analysis relative to MINT's case study on EEG diagnostics for ADD/ADHD in adults
Data available in the MINT drive, place from there into the data/ folder. To run the analysis, simply run:
$> python run.py
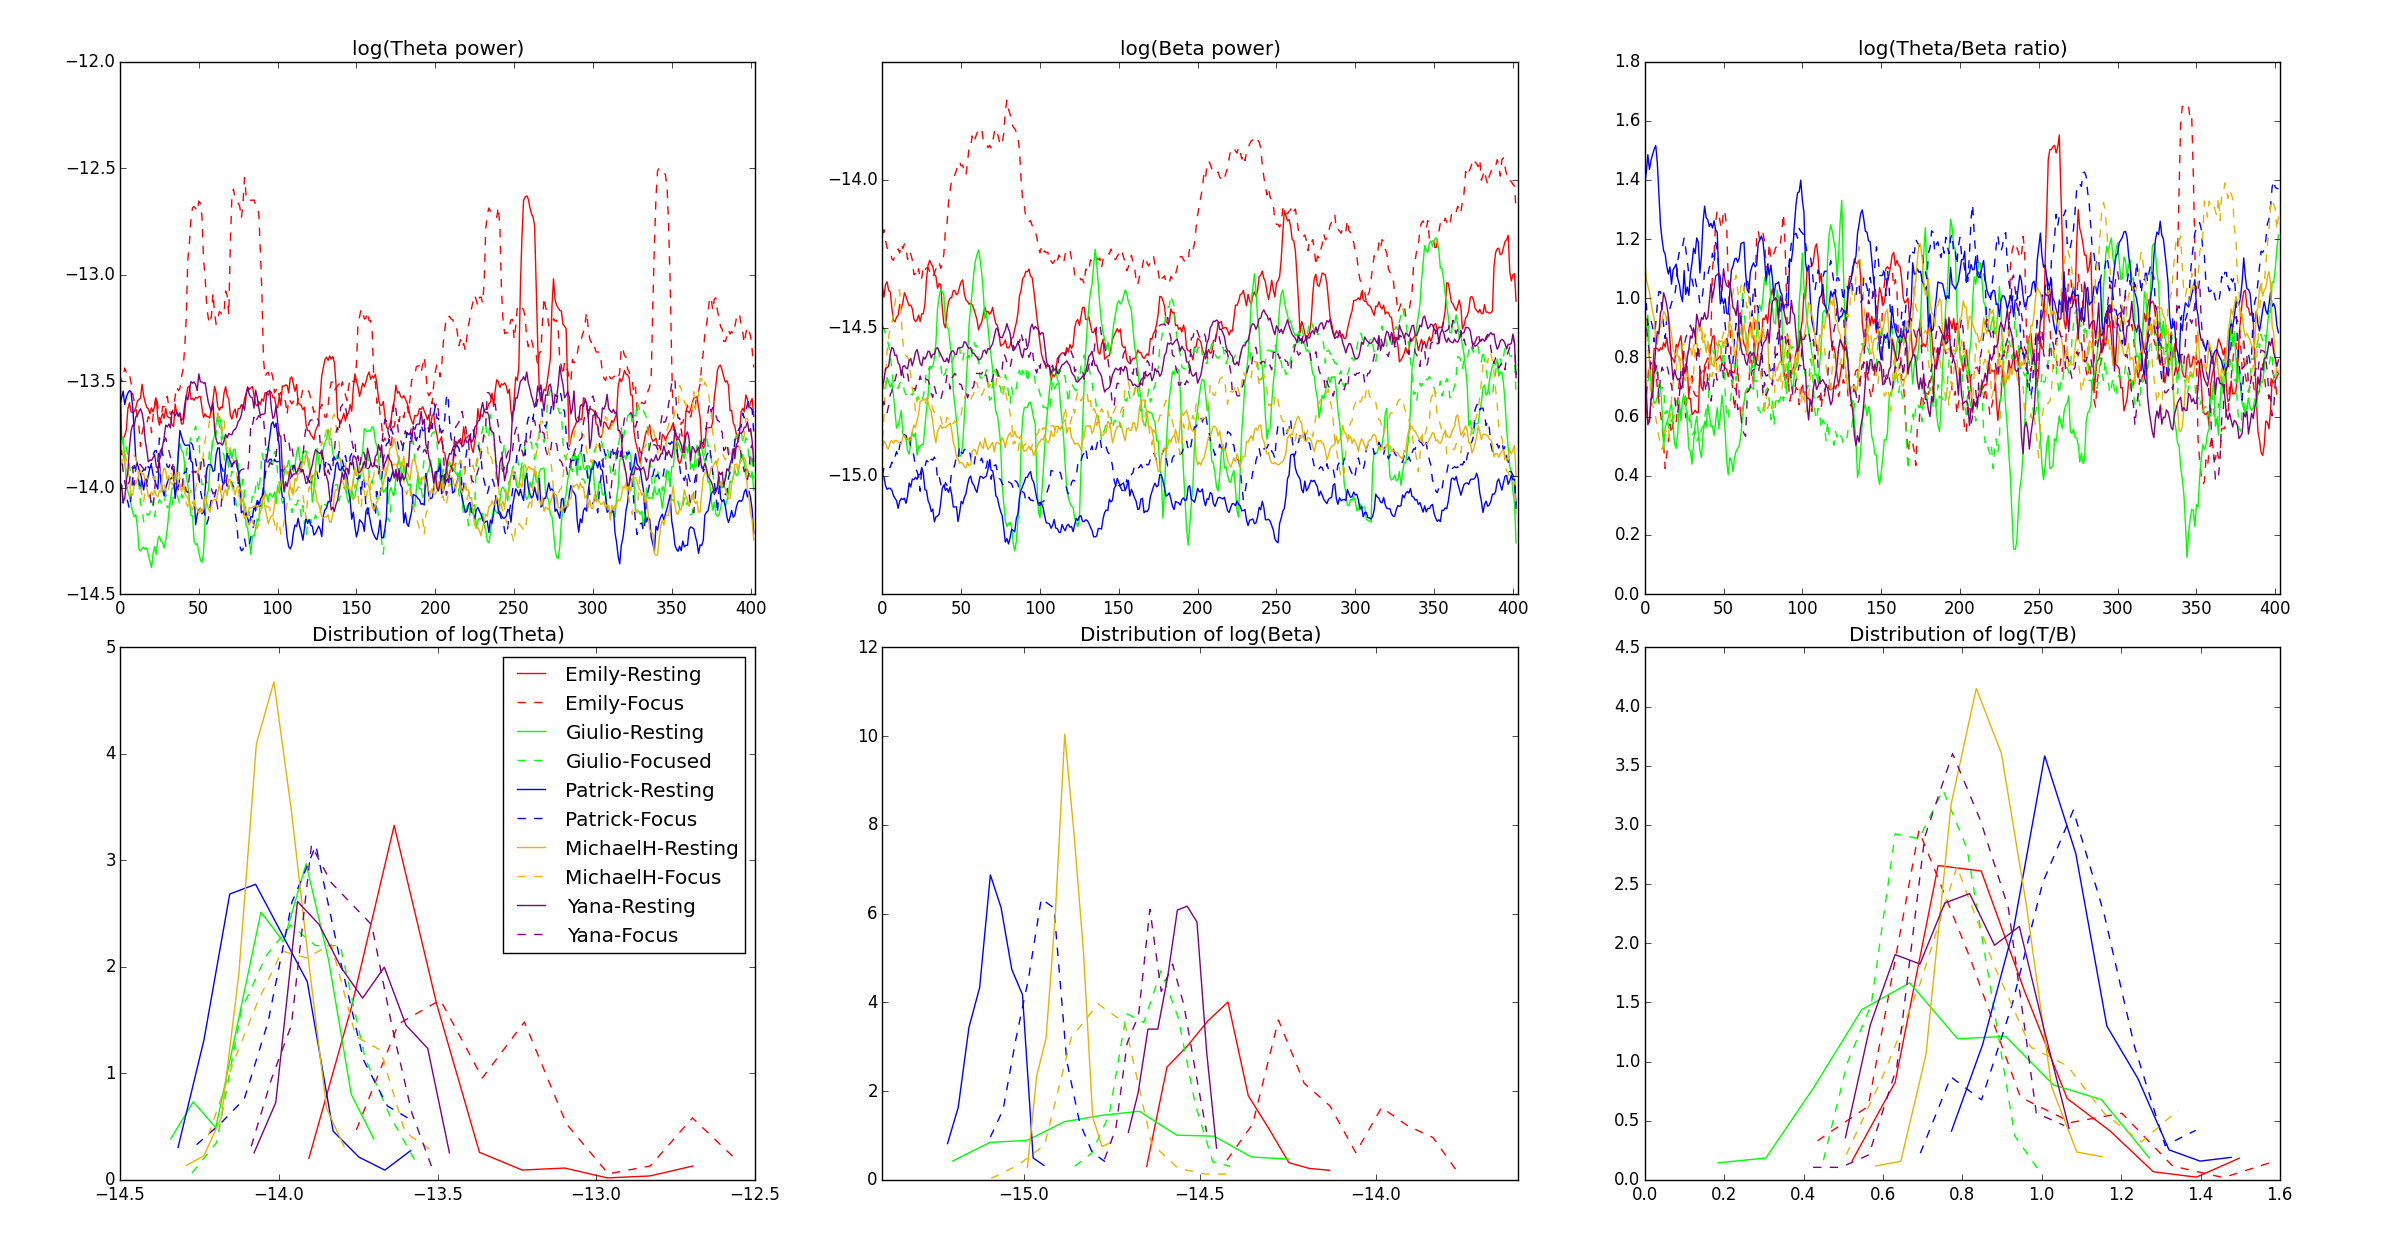
This analysis that is performed for each trial:
- Keeps only the signal between the 1 and 4.5 minute marks.
- Picks the closest channels to Fp1,F3,F7,FpZ,Fz,Fp2,F4,F8
- The average band power across those channels is calculated, for the theta (3.5 - 7.5hz) and beta (13 - 30hz) frequencies.
- The power is plotted as it varies over the duration of the trial, using log scale (first two graphs)
- The log of theta/beta ratio is also plotted (third graph)
- The distribution of each of these is also plotted underneath each, for comparison purposes.
The result should look something like this:

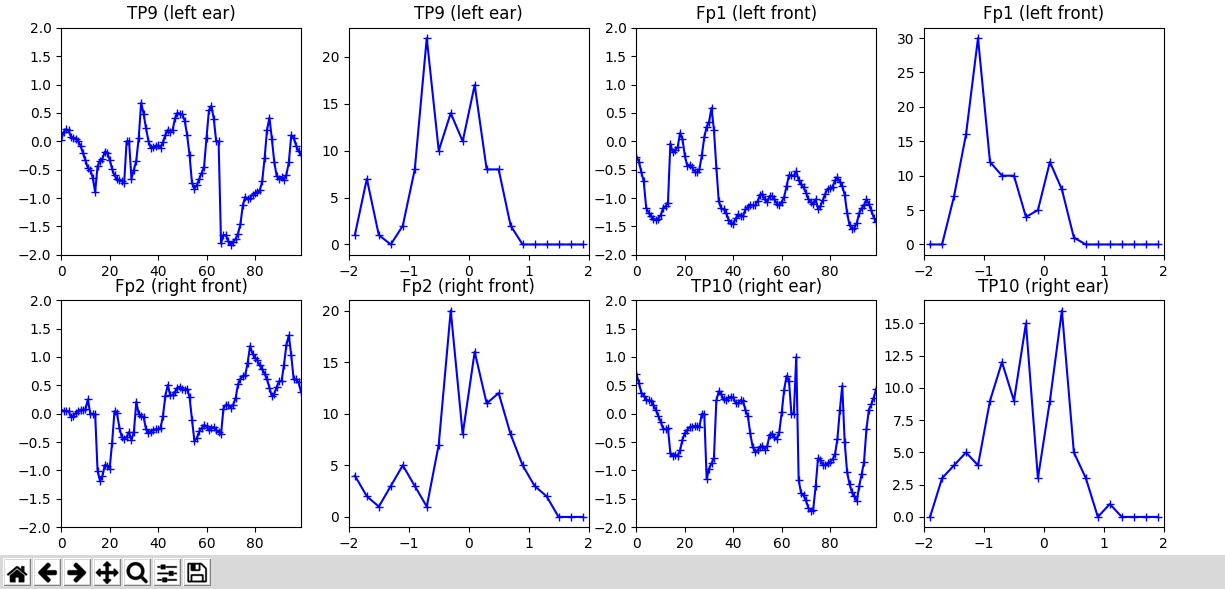
For our own testing, a realtime grapher of log(Theta/beta ratio) has been added to the liveStream folder. When a muse is running, this reads the theta and beta relative powers for each of the four channels, calculates the ratio, and adds this to both a timeseries and histogram plot for that channel. To view in realtime, the following needs to be done:
- Connect to the muse, serving OSC:
$> ./muse-io --osc osc.udp://localhost:5000 --device <device ID>
- Run the live streamer (requires python 3):
$> python3 plot.py
This will bring up eight live charts, being a time series and histogram of log(TBR) for each channel. In addition, if the channel is not connected properly, the graph will change color to be red. The output when fully connected should look something like this (although animated):

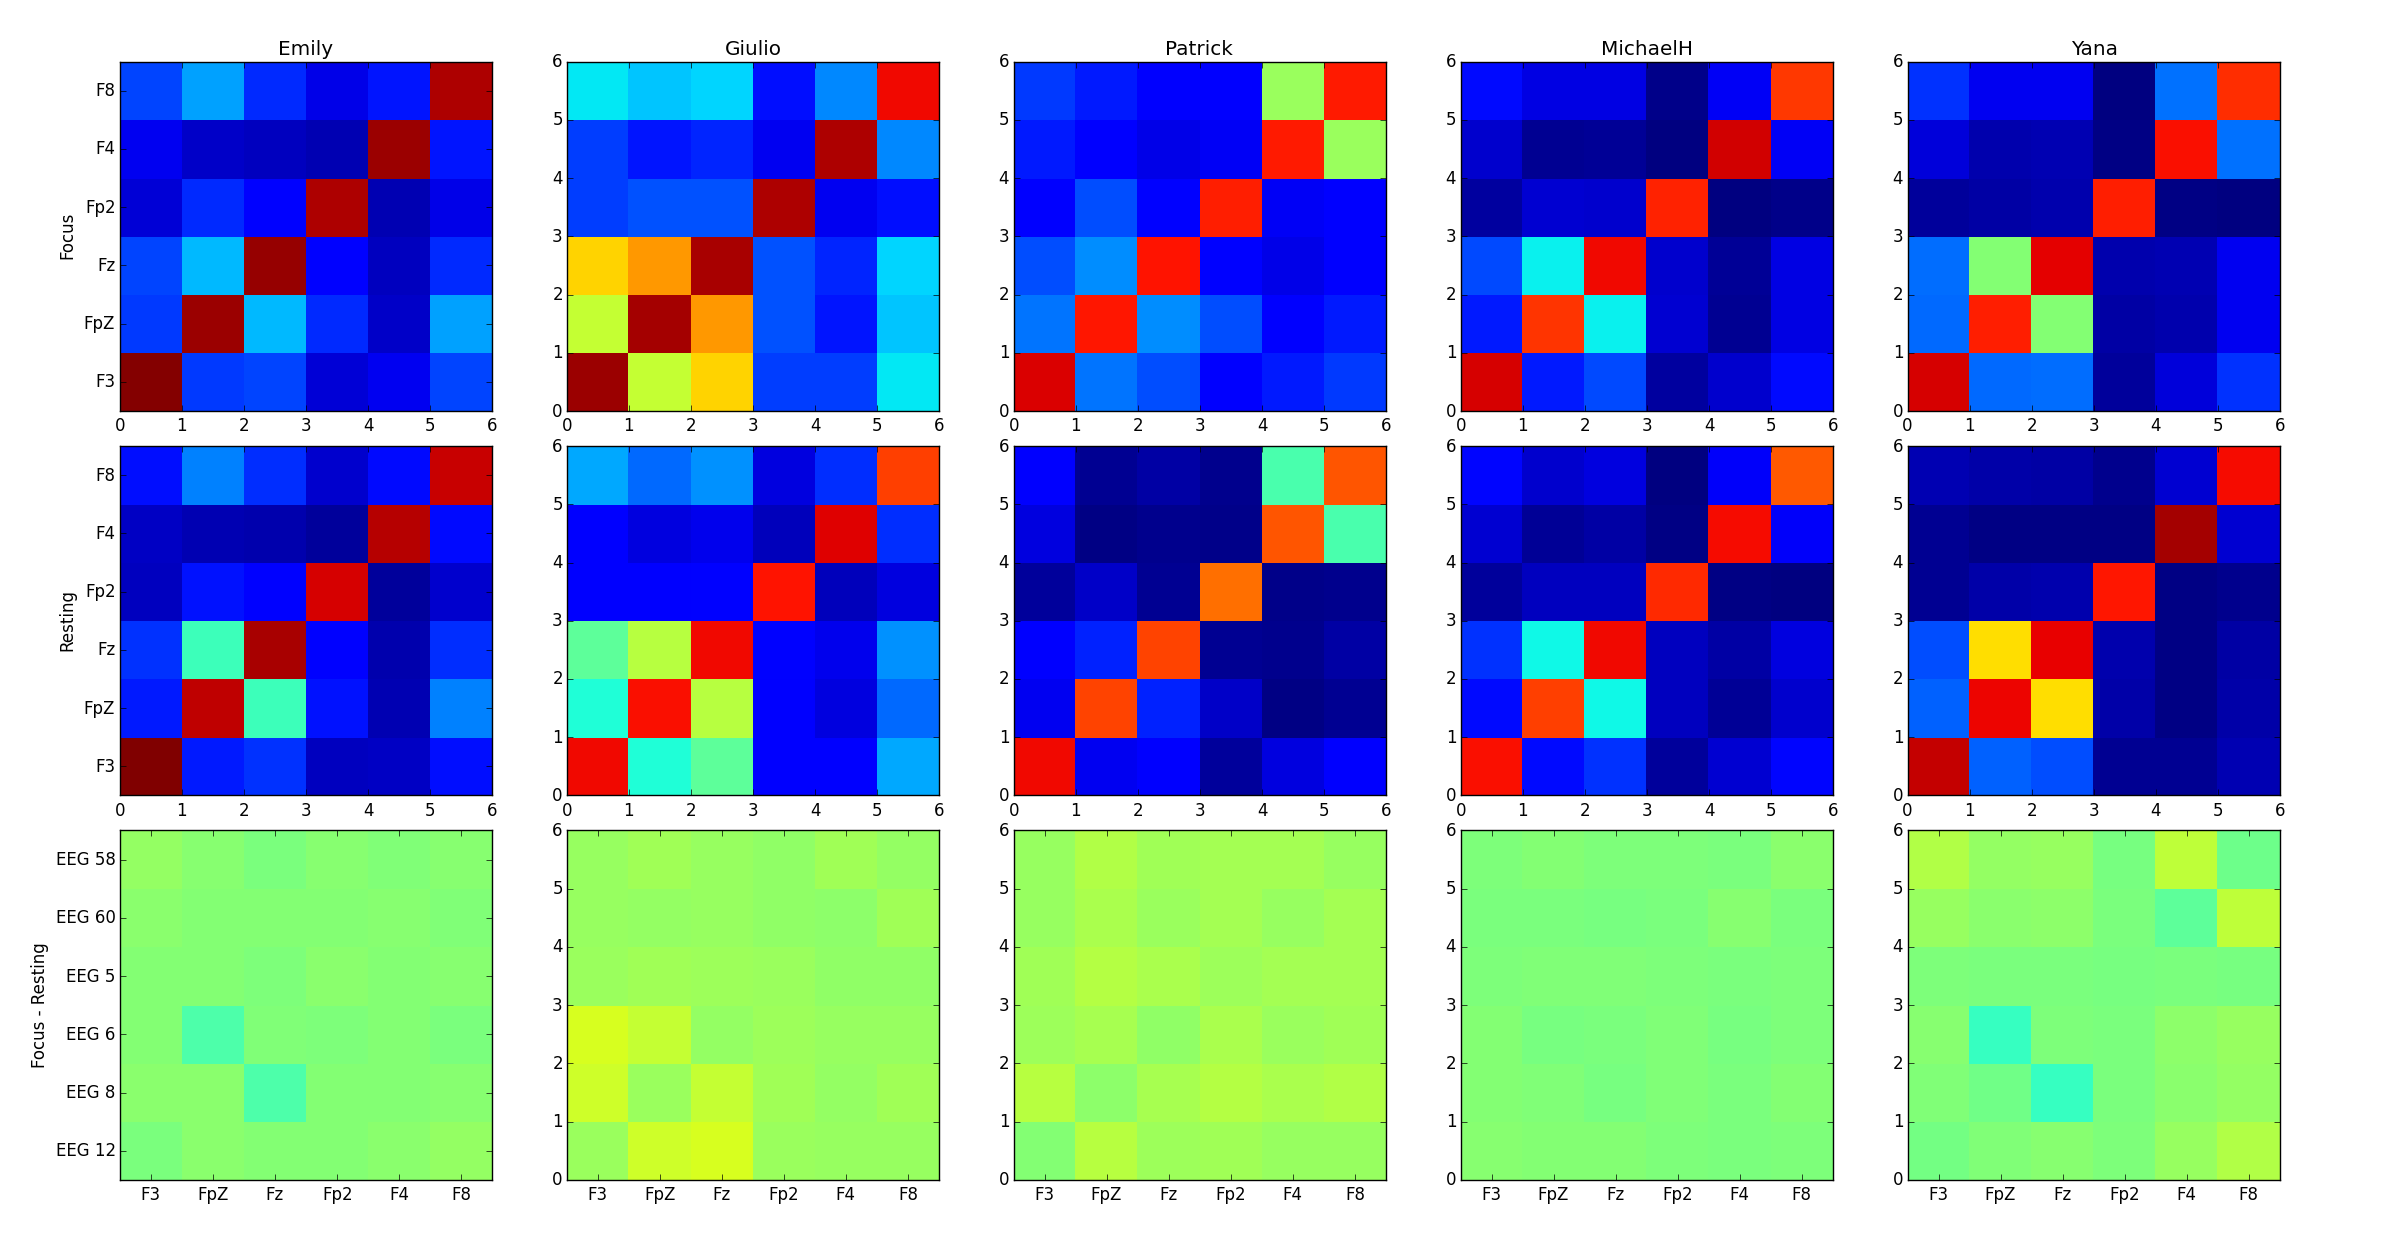
TODO: Describe. For now, results:
