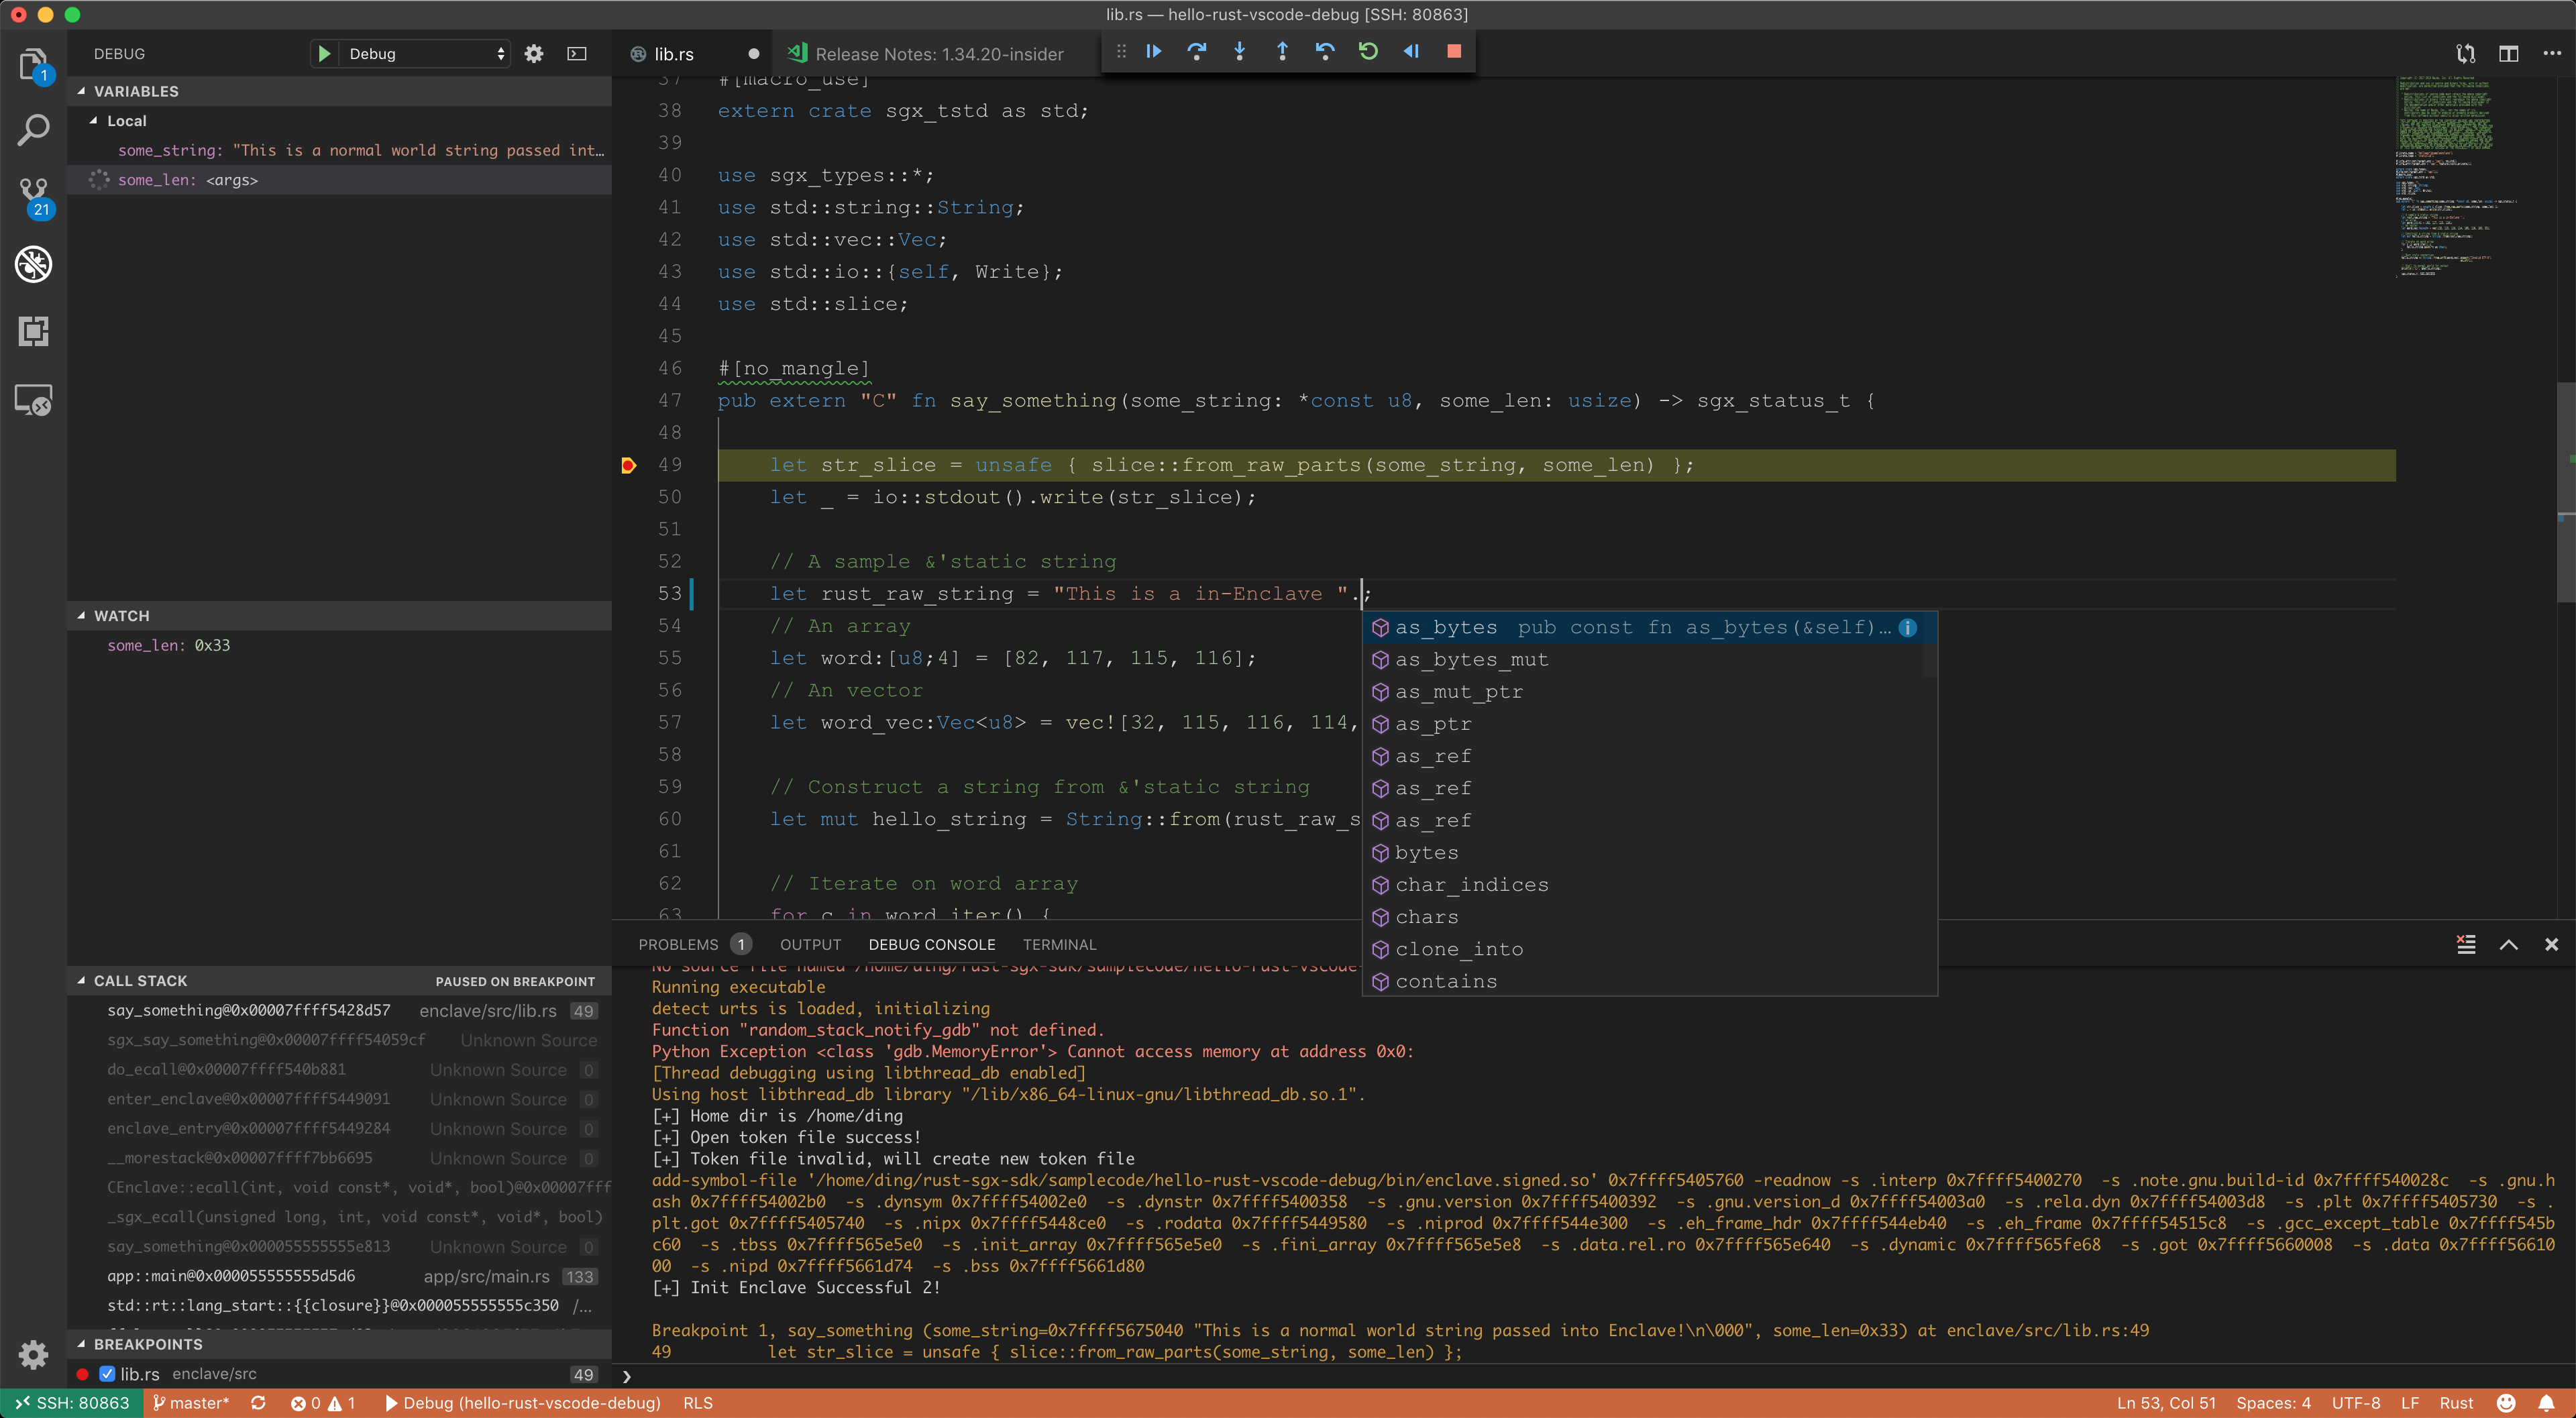
-
Notifications
You must be signed in to change notification settings - Fork 265
Use VSCode rls rust analysis sgx gdb for graphic developing (not in docker)
This is my personal setup and contains some IP/path/usernames. Please tweak them in your environment.
- Use Visual Code Insider and the Remote - SSH plugin to establish a vscode-ssh session.
- Tweak a project with a new
Cargo.tomlworkspace and allMakefiles. This enablesrls. - Tweak the build options for compiling in debug mode.
- Use Native Debug plugin for graphic debugging.
- Visual Code Insider installed on your machine. OS is flexible.
- Remote Linux supports Intel SGX, with SSH service started.
- Remote Linux could be the same machine. Just ignore the
vscode-sshplugin mentioned in this wiki page and you'll be fine.
My personal setup is:
- Macbook. MacOS 10.14.4 + VSCode Insider.
- Remote desktop PC running Ubuntu Linux 18.04. Intel SGX v2.5.
-
sgx-gdbthrows Python exception ongdb> 7.12 on every ocall. As of 05-12-2019,sgx-gdbcannot support gdb 8.
- Setup a convenient way for ssh login. I always append my
~/.ssh/id_rsa.pubto the remote~/.ssh/authorized_keys. - Install the Remote - SSH plugin.
- Establish a vscode-ssh session to the remote Linux.
hello-rust-vscode-debug is an example. Differences between this and hello-rust are:
- An extra
Cargo.tomlat the root, which contains two Rust crates:appandenclave. This change would result in changing the path oftargetfolders. - Tweak
Makefileandenclave/Makefileand correct the path oftargetfolders. - Tweak
Makefileandenclave/Makefileto enable debug compilation. Changes include: (1) remove--releaseincargo build, (2) add-ggdbtoSGX_COMMON_FLAGS.
After these steps, the hello-rust-vscode-debug should be an rls-friendly project. And open the remote folder of it in the VSCode main screen "Start - open folder". Then autocompletion should work!
Now we have a vscode-ssh session to the remote Linux and an opened folder of hello-rust-vscode-debug. The next step is to configure a correct launch.json for Native Debug plugin. Now open the debug panel of VS code and click on the gear icon to open launch.json in the editor.
{
    // Use IntelliSense to learn about possible attributes.
    // Hover to view descriptions of existing attributes.
    // For more information, visit: https://go.microsoft.com/fwlink/?linkid=830387
    "version": "0.2.0",
    "configurations": [
        {
            "name": "Debug",
            "type": "gdb",
            "request": "launch",
            "target": "app",
            "cwd": "${workspaceRoot}/bin",
            "valuesFormatting": "parseText",
            "gdbpath": "sgx-gdb",
            "ssh": {
                "forwardX11": false,
                "host": "172.19.32.44", // your IP
                "cwd": "${workspaceRoot}/bin",
                 // SSH private key on remote machine. Add the pub key to ~/.ssh/authorized_keys
                 // This ssh configuration is established from host to host, because the current
                 // vscode session is "within a ssh session established by vscode-ssh".
                 // I think this might be a bug but can hardly be resolved.
                "keyfile": "/home/ding/.ssh/id_rsa", // private key
                "user": "ding",
                "bootstrap": "source /opt/sgxsdk/environment",
                "port": 22
            }
        }
    ]
}
name,type,request,valuesFormatting are default values. cwd is the working directory we launch the app, so it should be the bin folder. target is the debugee executable so it should be the app. host is the IP address of your Linux machine. Then comes the tricky part: ssh. It means that we use an extra ssh session for debugger, within the current vscode-ssh session. This means that we are here creating an additional ssh session from remote machine to itself. Only in this way could we setup the environment using the Intel's script before launching sgx-gdb. So we need to add the public key ~/.ssh/id_rsa to ~/.ssh/authorized_keys and demonstrate the corresponding private key as ~/.ssh/id_rsa.
Having this launch.json configured correctly, we could simply set up a breakpoint on the first line of say_something and start debugging. Enjoy!
