As there were no existing dataset that fitted our requirements, we decided to create our own datasets. We wanted to be sure to have data that is as accurate as possible. As a consequence, we first started to talk with peoples who know oenology very well. We created 4 different datasets corresponding to the 4 main visualisation that we'll embed in our webpage, as well as a more complete one. To create these datasets, we used different sources of information which we joined together. We acquired all the data by scrapping different websites and combining some of it with information coming from specialized books to check accuracy.
- Our first dataset is about wine colours. Wine experts use a lot of names to describe the colours of different wines. Therefore, we had to create a mapping between all those names and the colours values.
- Our second dataset is about aromas. Aromas are very important in wine. Wine smell is as important as its taste. Therefore, we retrieved a lot of aromas that we can find in wines and grouped them according to bigger families of flavours.
- Our third dataset is a mapping between grape varieties and their typical aromas.
- Pairing food and wine is one of the most interesting and hard topics at the same time. Our fourth dataset contains kinds of wines and food that can go well together.
- Our final dataset is a list of grape varieties associated with a lot of tasting information coming from experts such as acidity, sweetness, aromas, flavours, food pairing and more.
We therefore now have a lot of nice data to choose from. We'll see exactly what information we'll use when we start digging deeper in the different visualizations. We haven't done a lot of data-analysis as we did not need it considering the fact that we created all the dataset ourselves and that we decided on the data we wanted to use before crafting the different datasets. We only checked a few statistics to help us in the design process of our future visualization.
With our visualization, we want to present the fundamentals of wine tasting. To many, diving into wine tasting is a real challenge: how to interpret what I sense (sight, smell and taste) while drinking wine? Our goal is to break down those sensations and explain them through simple visualizations. We would like to take the taster and guide them through all steps, one by one. First, some basics and a quick introduction to help prepare them prepare for the tasting. Then, dedicated parts for each of the following senses: sight, smell and taste. The main targeted audience is beginners in wine tasting. Anyone who wants to discover wine can use our project to grasp the fundamentals of wine tasting. Of course, any person that already has knowledge about wine can come to enjoy our visualizations.
For our data analysis, we used the pandas python library. You can find it the following jupyter notebook. As mentioned in the section about the datasets, we only extracted some simple statistics about our data such as the number of wine varieties or the number of unique flavours.
Most guides we came across were very dense in information and presented only static visualizations, if any. Furthermore, wine is often presented as a serious, complex topic. In our approach we want to (a) break it down into simple steps by clearly structuring our website and presenting one concept at a time and (b) make it a fun experience for the user by adding a pinch of humour and incorporating a bunch of interactive visualizations that the user can play around with. We believe that joining those two sides will help the reader to have a tasting experience more enjoyable. We also want to add interaction to our illustrations to make the reading more immersive.
Our inspirations were very diverse: some dull and serious but accurate and complete, some colourful and simple but maybe less accurate, some related to wine and some completely unrelated but that had caught our eye!
- A simple yet complete guide on wine tasting, but not very good looking and (almost) only text: vitiplace
- A series of (static) visualisations by Rachel Wood on the topic of wine: the wine nerd
- An interactive visualization of wine reviews: wine data viz
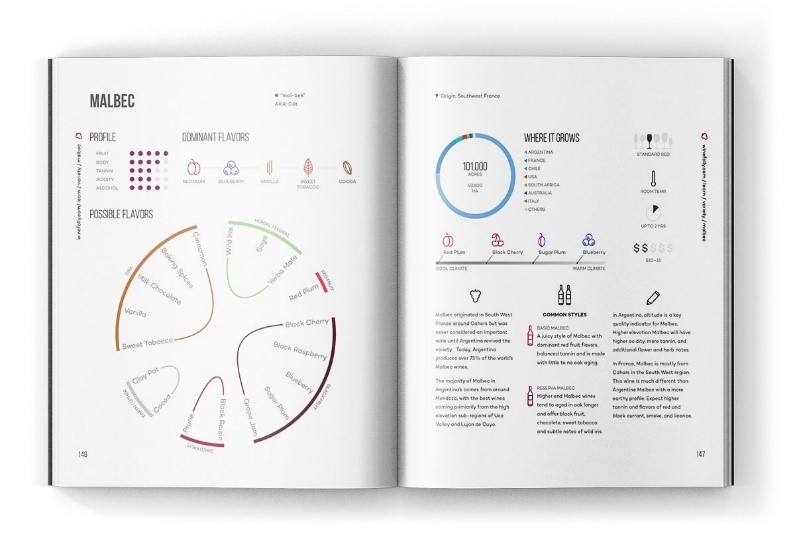
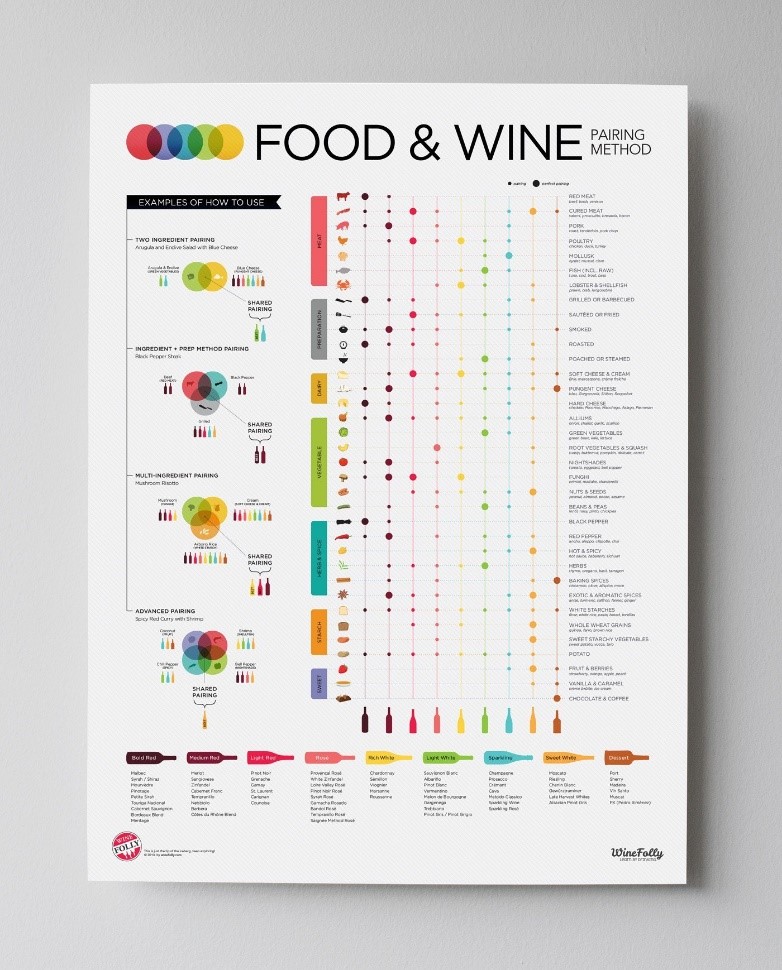
- Colourful posters and books that help educate people about wine (see examples below): winefolly
- Nice example that interleaves the story with animations by scrolling and lets the user play with some of the visualizations: pockets


