-
Notifications
You must be signed in to change notification settings - Fork 10
New issue
Have a question about this project? Sign up for a free GitHub account to open an issue and contact its maintainers and the community.
By clicking “Sign up for GitHub”, you agree to our terms of service and privacy statement. We’ll occasionally send you account related emails.
Already on GitHub? Sign in to your account
make odp_nway_rbh plot a ribbon diagram #31
Comments
|
Made one change that @zolotarovgl requested. This feature uses the false discovery rate value calculated during nway-rbh instead of the pairwise Fisher's exact test used in the normal |
|
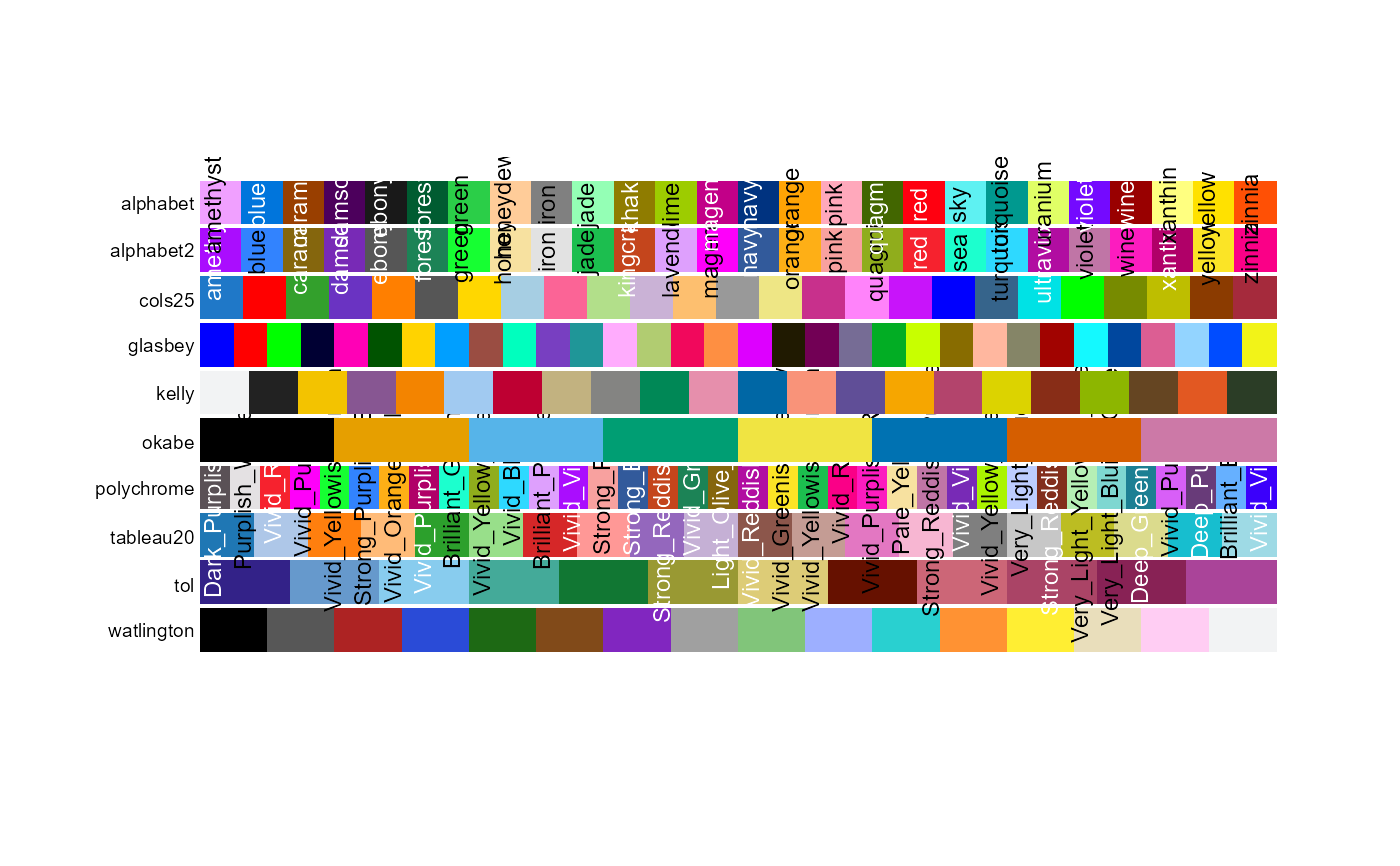
One problem with this is that the random color generator that I implemented generates colors that look like the palette of Candyland. Any ideas on how to make more appealing random colors, @beroe? Code in the link above. |
|
I think totally random colors are always going to be problematic, given the potential for overlap or getting lost on light backgrounds. You could clamp the generator so the numbers can range from say |
|
This is absolutely great, Darrin! |
|
FWIW, here are the hex tables for the two mentioned palettes (I lowered some of the fully saturated ones). |
|
@conchoecia I found the call to |
|
@beroe The function that is called is here: odp/scripts/odp_color_manager.py Line 314 in 5f147cb
The only place it is called now is here, I think: Line 565 in 5f147cb
The function |
|
Using |


The species order can be set by specifying the order in the analyses section.
The text was updated successfully, but these errors were encountered: