FabricObserver (FO) is a production-ready watchdog service with an easy-to-use extensibility model, written as a stateless, singleton Service Fabric .NET 8 application that by default
- Monitors a broad range of physical machine resources that tend to be very important to all Service Fabric services and maps these metrics to the related Service Fabric entities.
- Runs on multiple versions of Windows Server and Ubuntu.
- Provides an easy-to-use extensibility model for creating custom Observers out of band (so, you don't need to clone the repo to build an Observer). In this way, FabricObserver is also an "Observer" platform.
- Supports Configuration Setting Application Updates for any observer for any supported setting.
- Is actively developed in the open.
FabricObserver targets SF runtime versions 9 and higher.
FO is a Stateless Service Fabric Application composed of a single service that runs on every node in your cluster, so it can be deployed and run alongside your applications without any changes to them. Each FO service instance knows nothing about other FO instances in the cluster, by design.
If you run your apps on Service Fabric, then you should definitely consider deploying FabricObserver to all of your clusters (Test, Staging, Production).
To quickly learn how to use FO, please see the simple scenario-based examples.
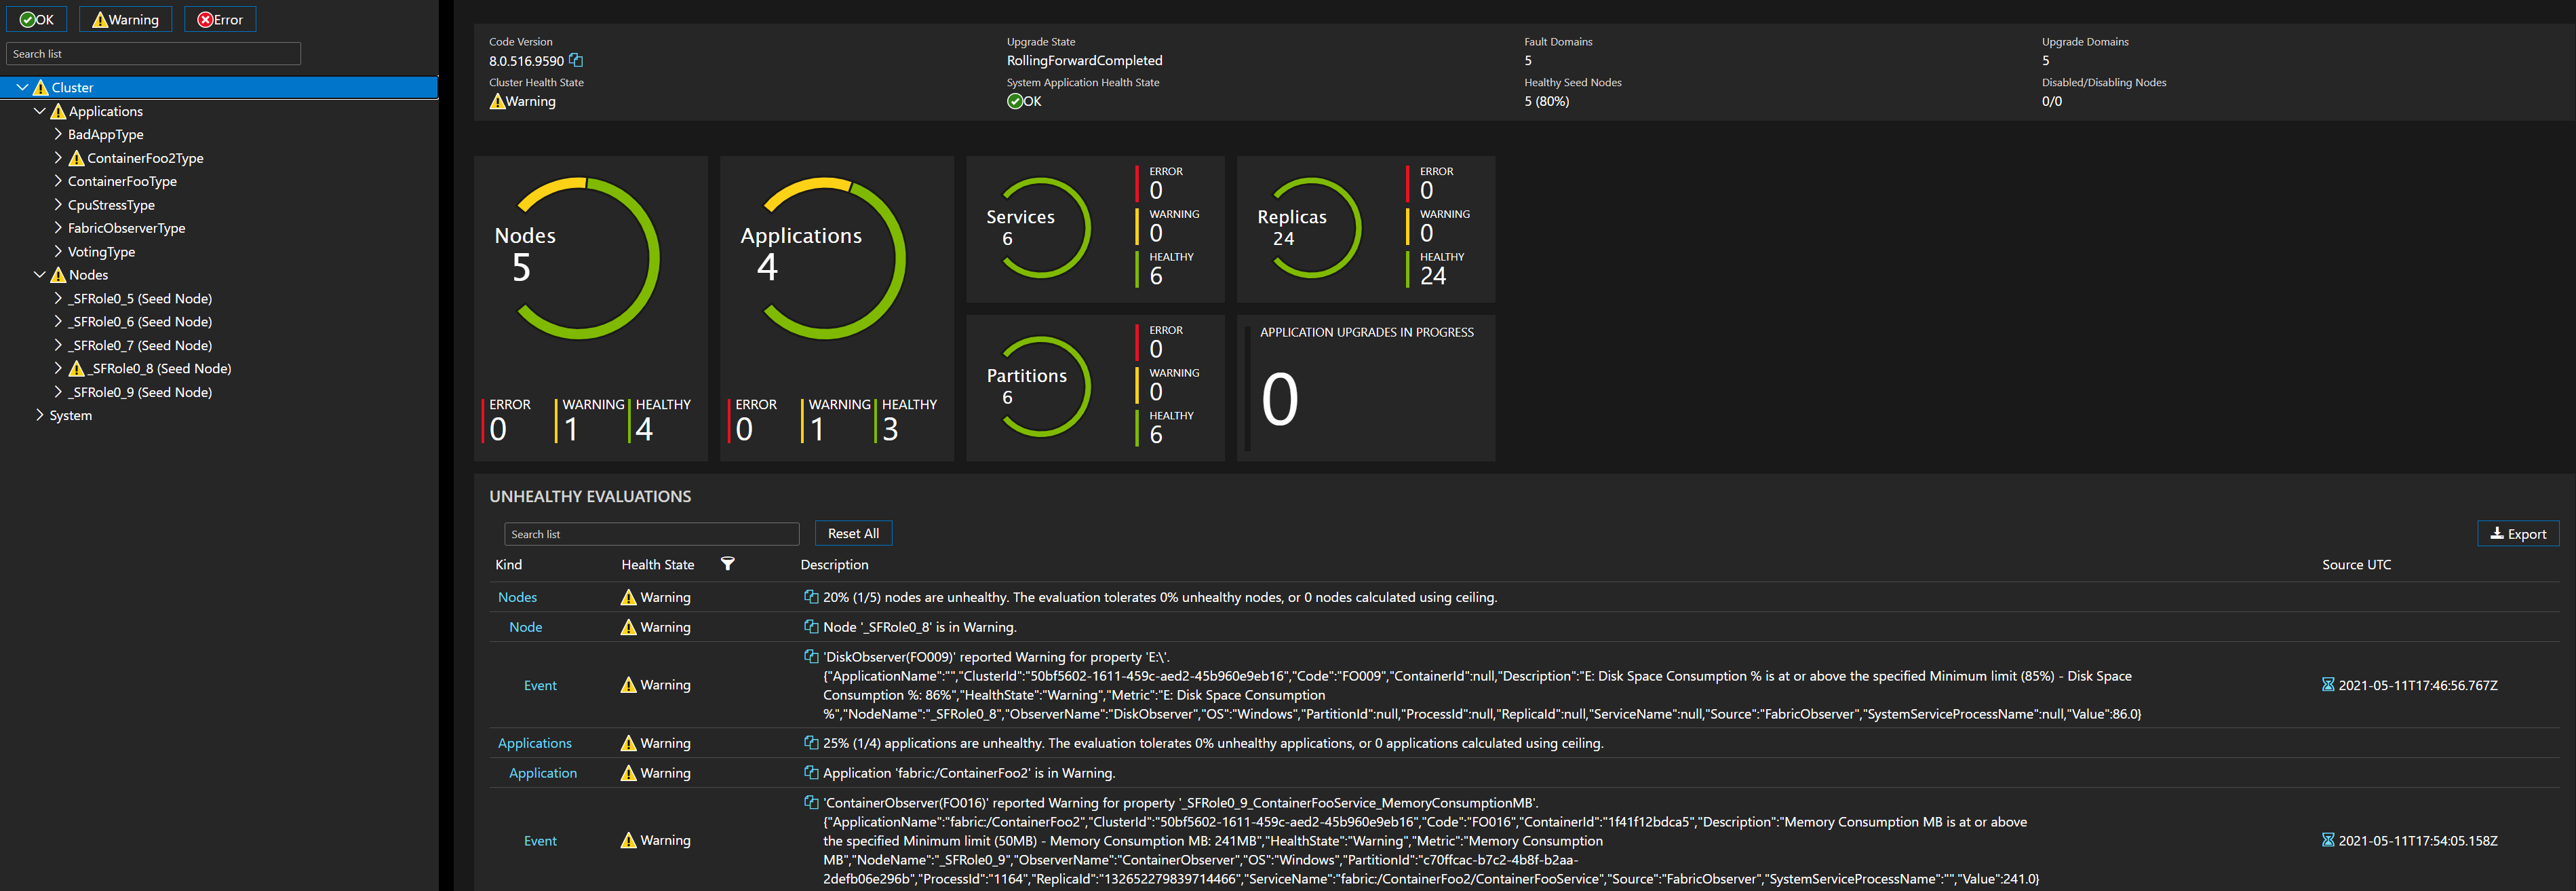
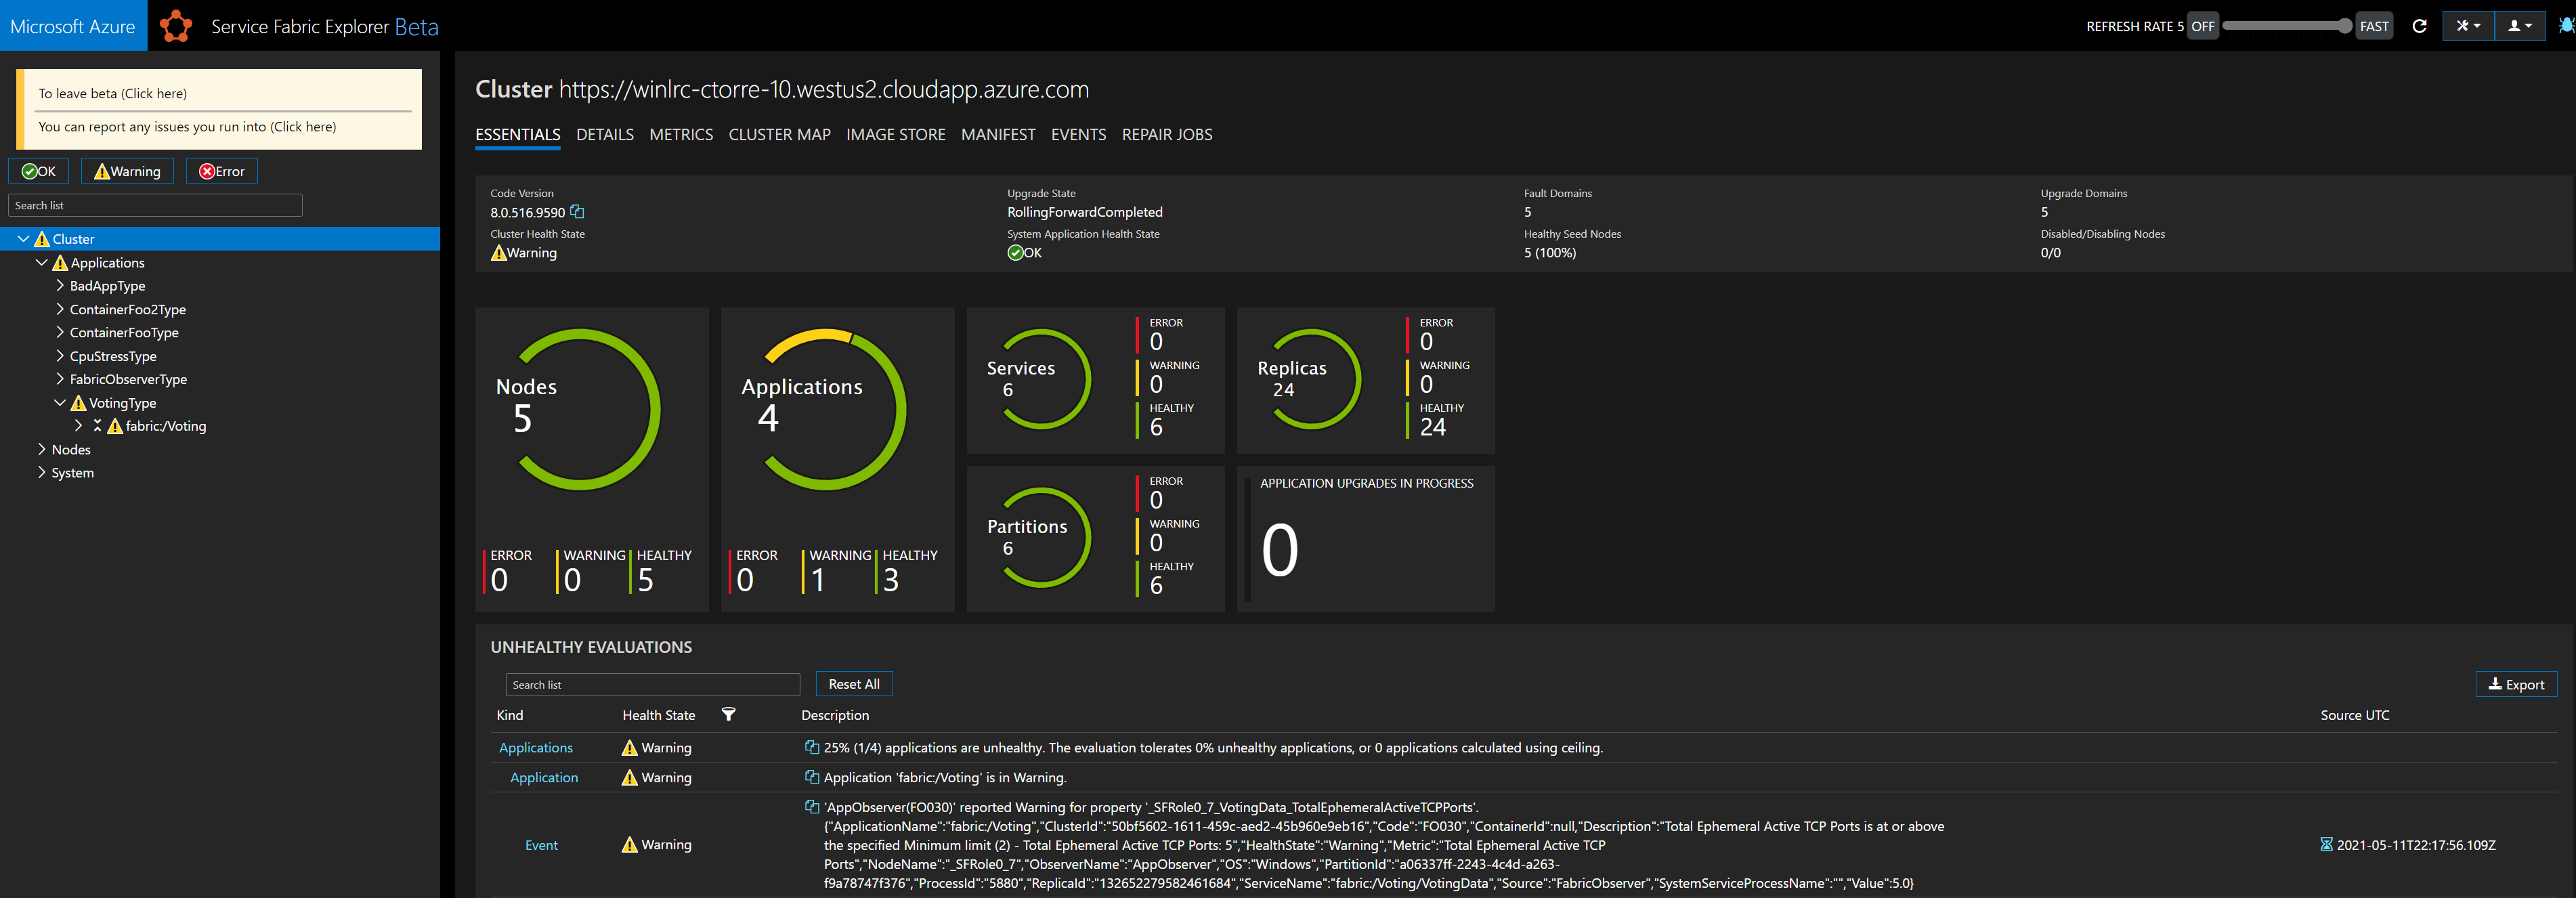
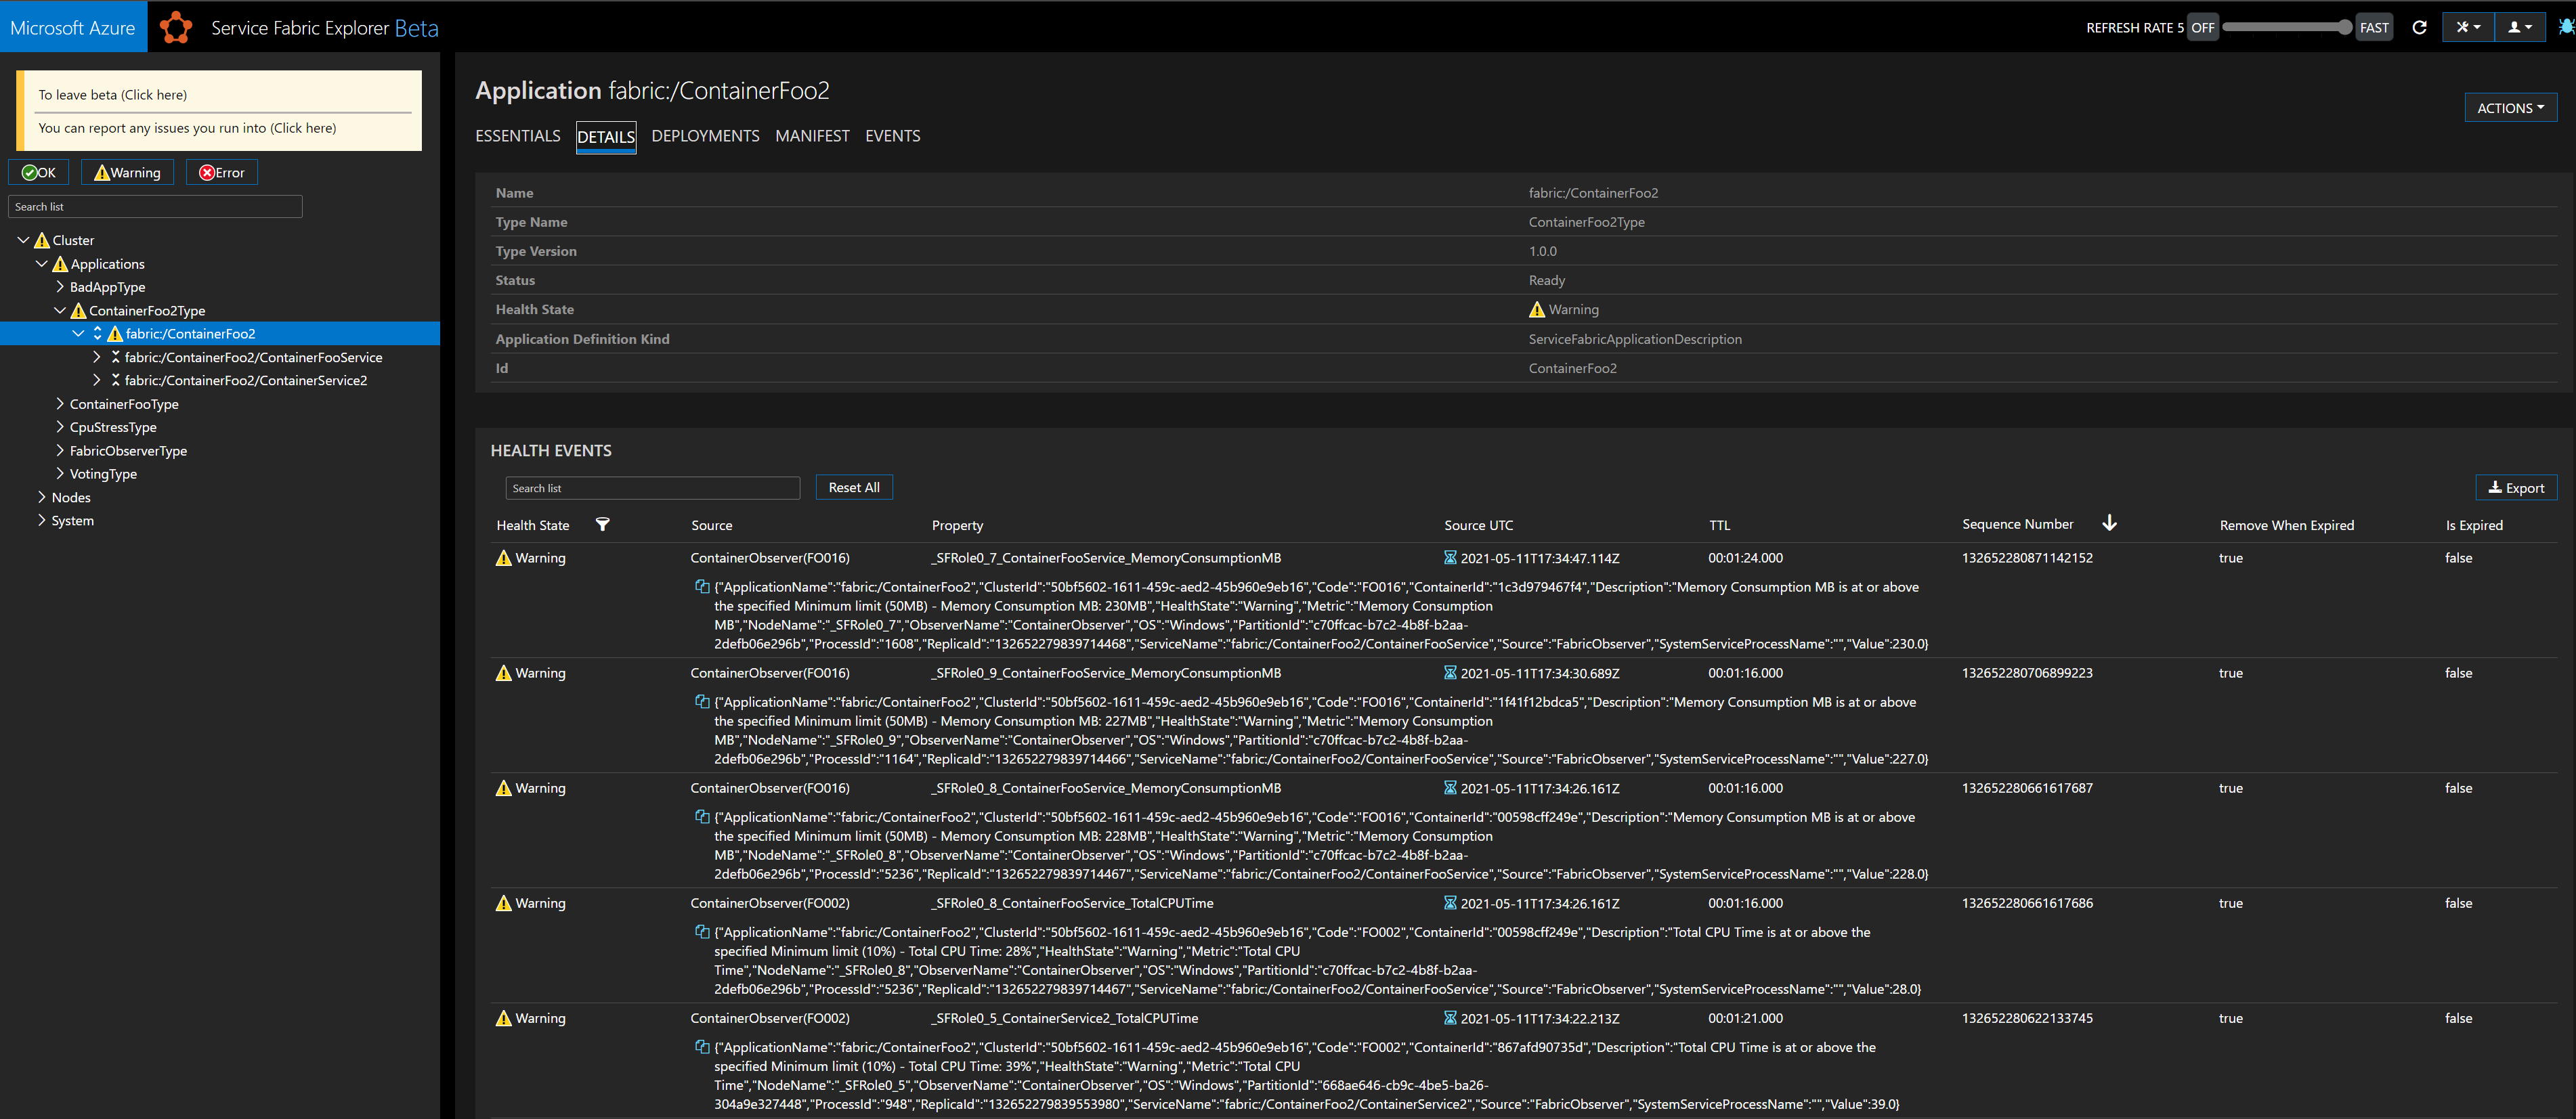
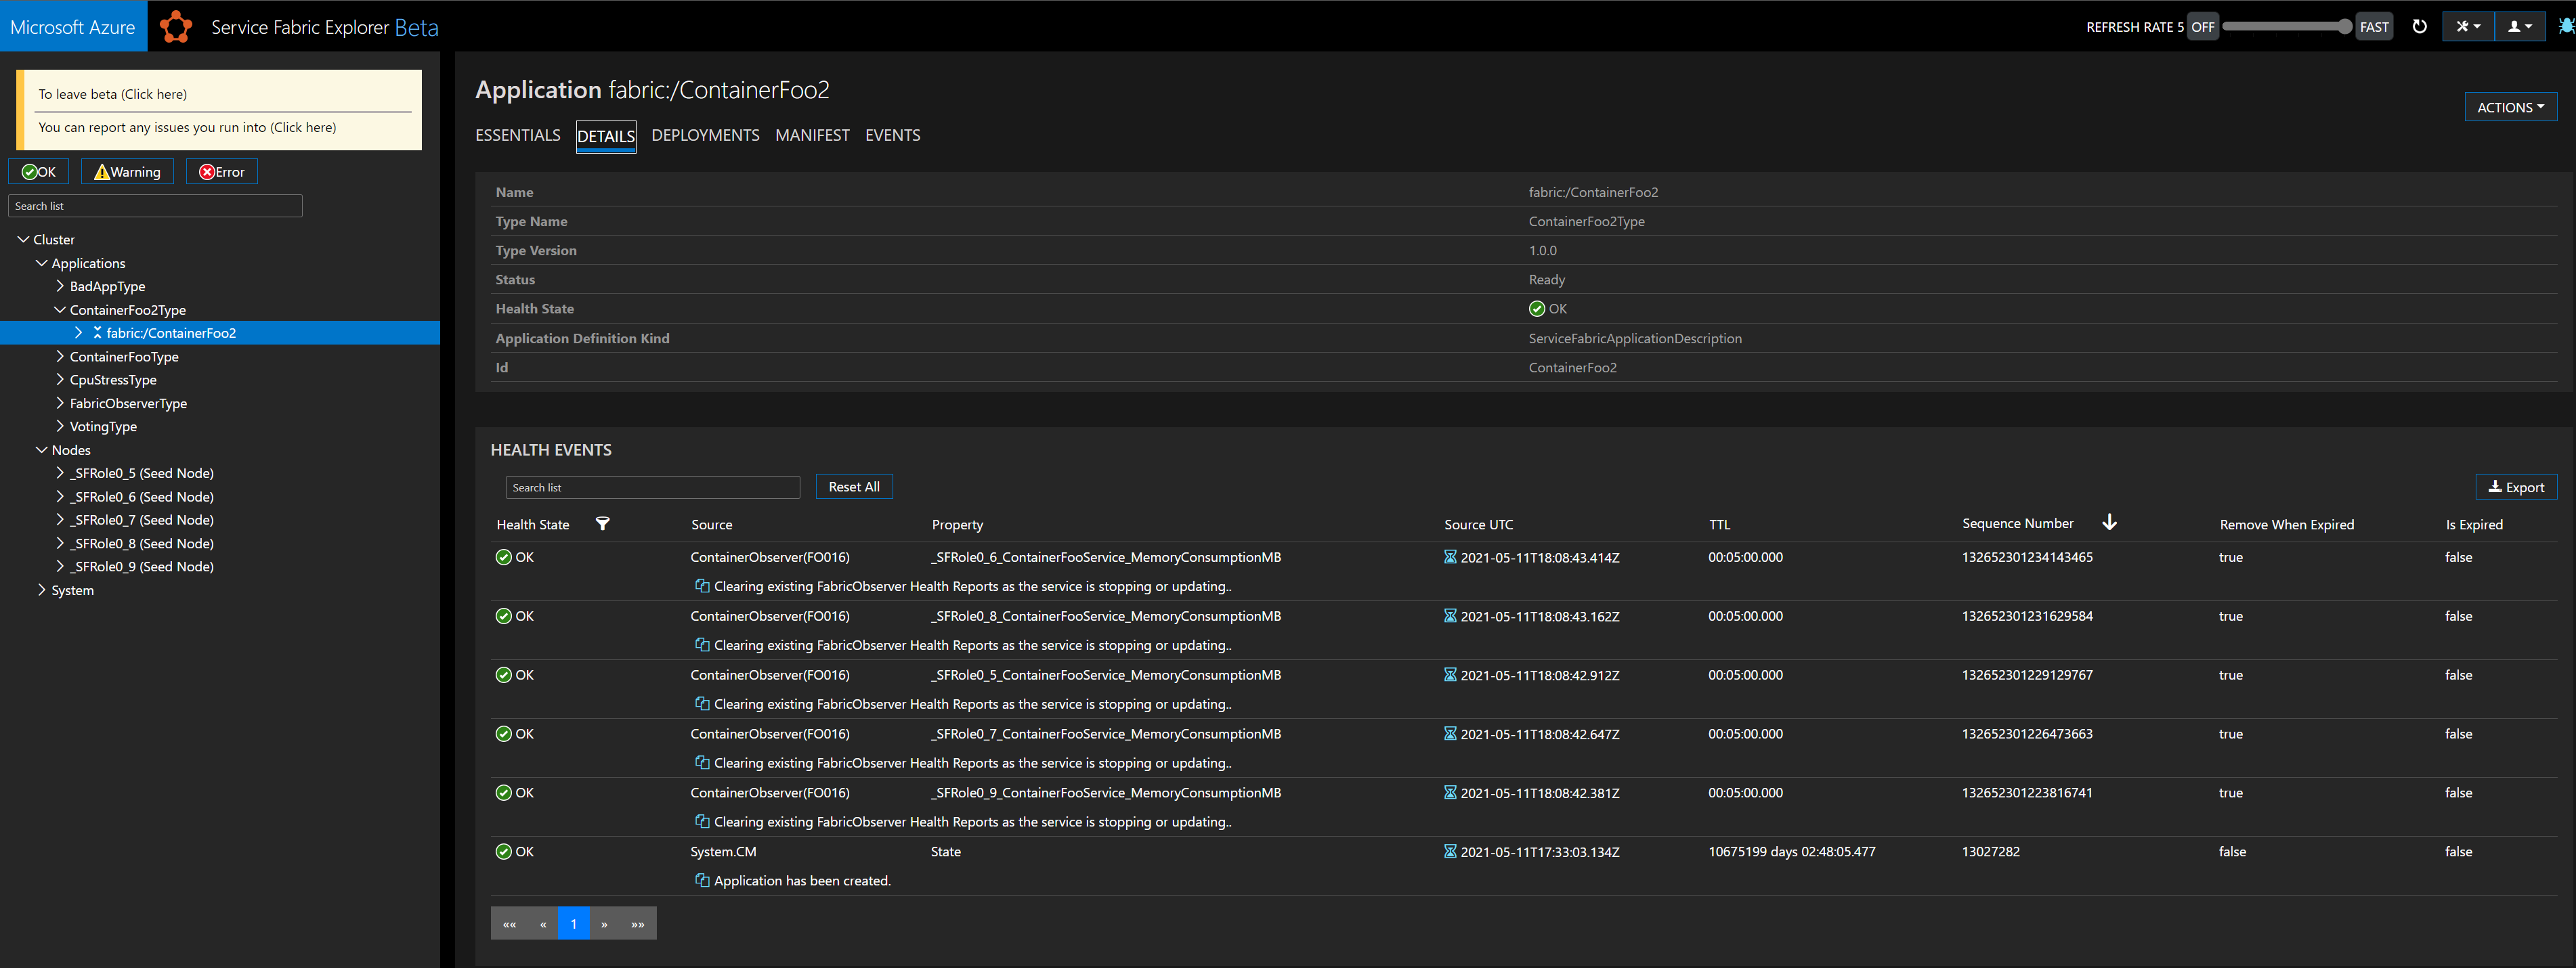
Application Level Warnings:
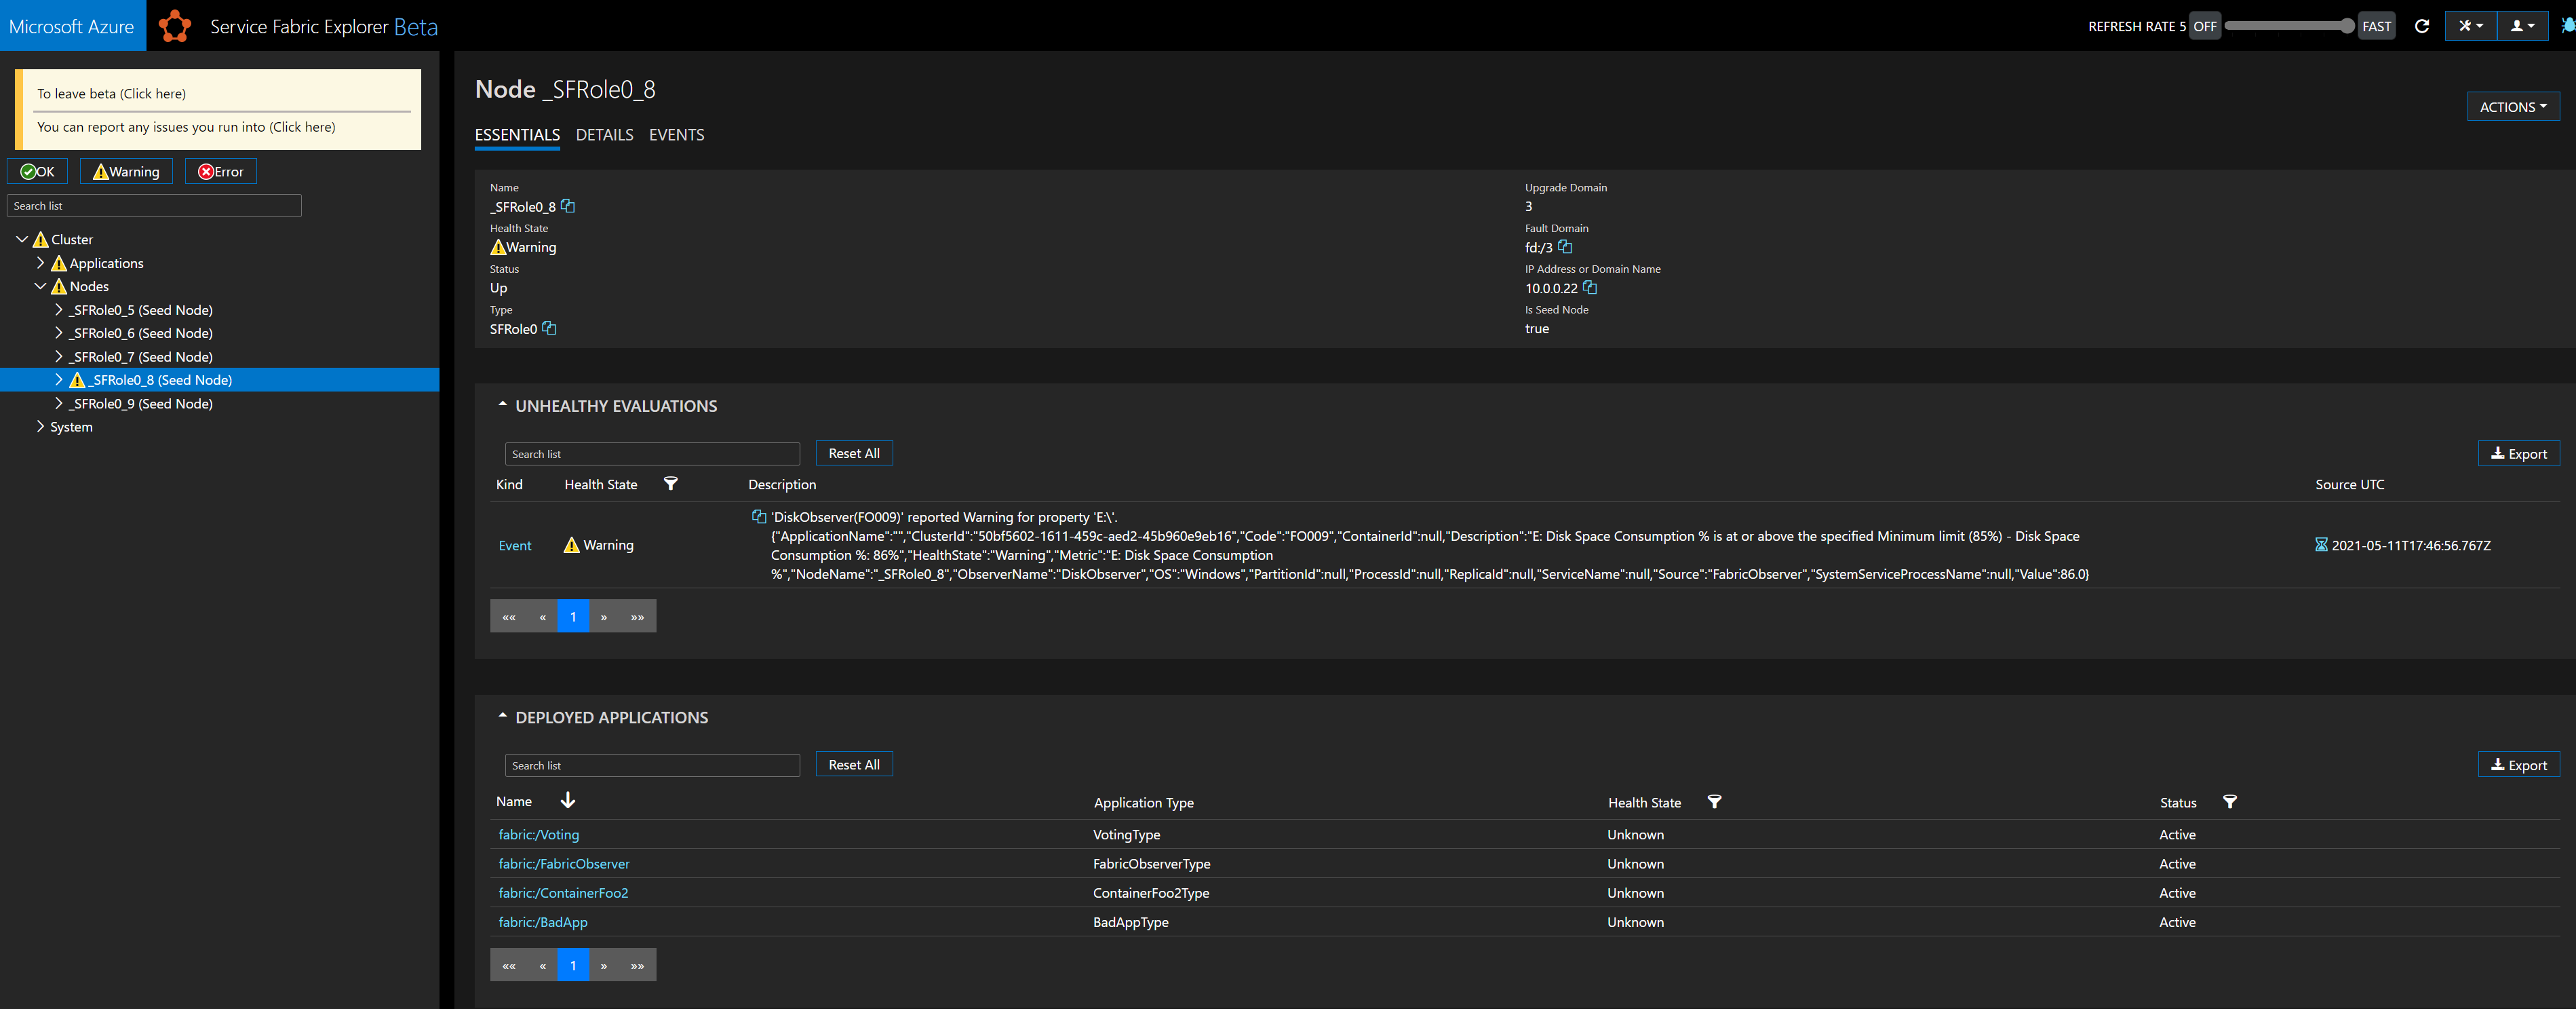
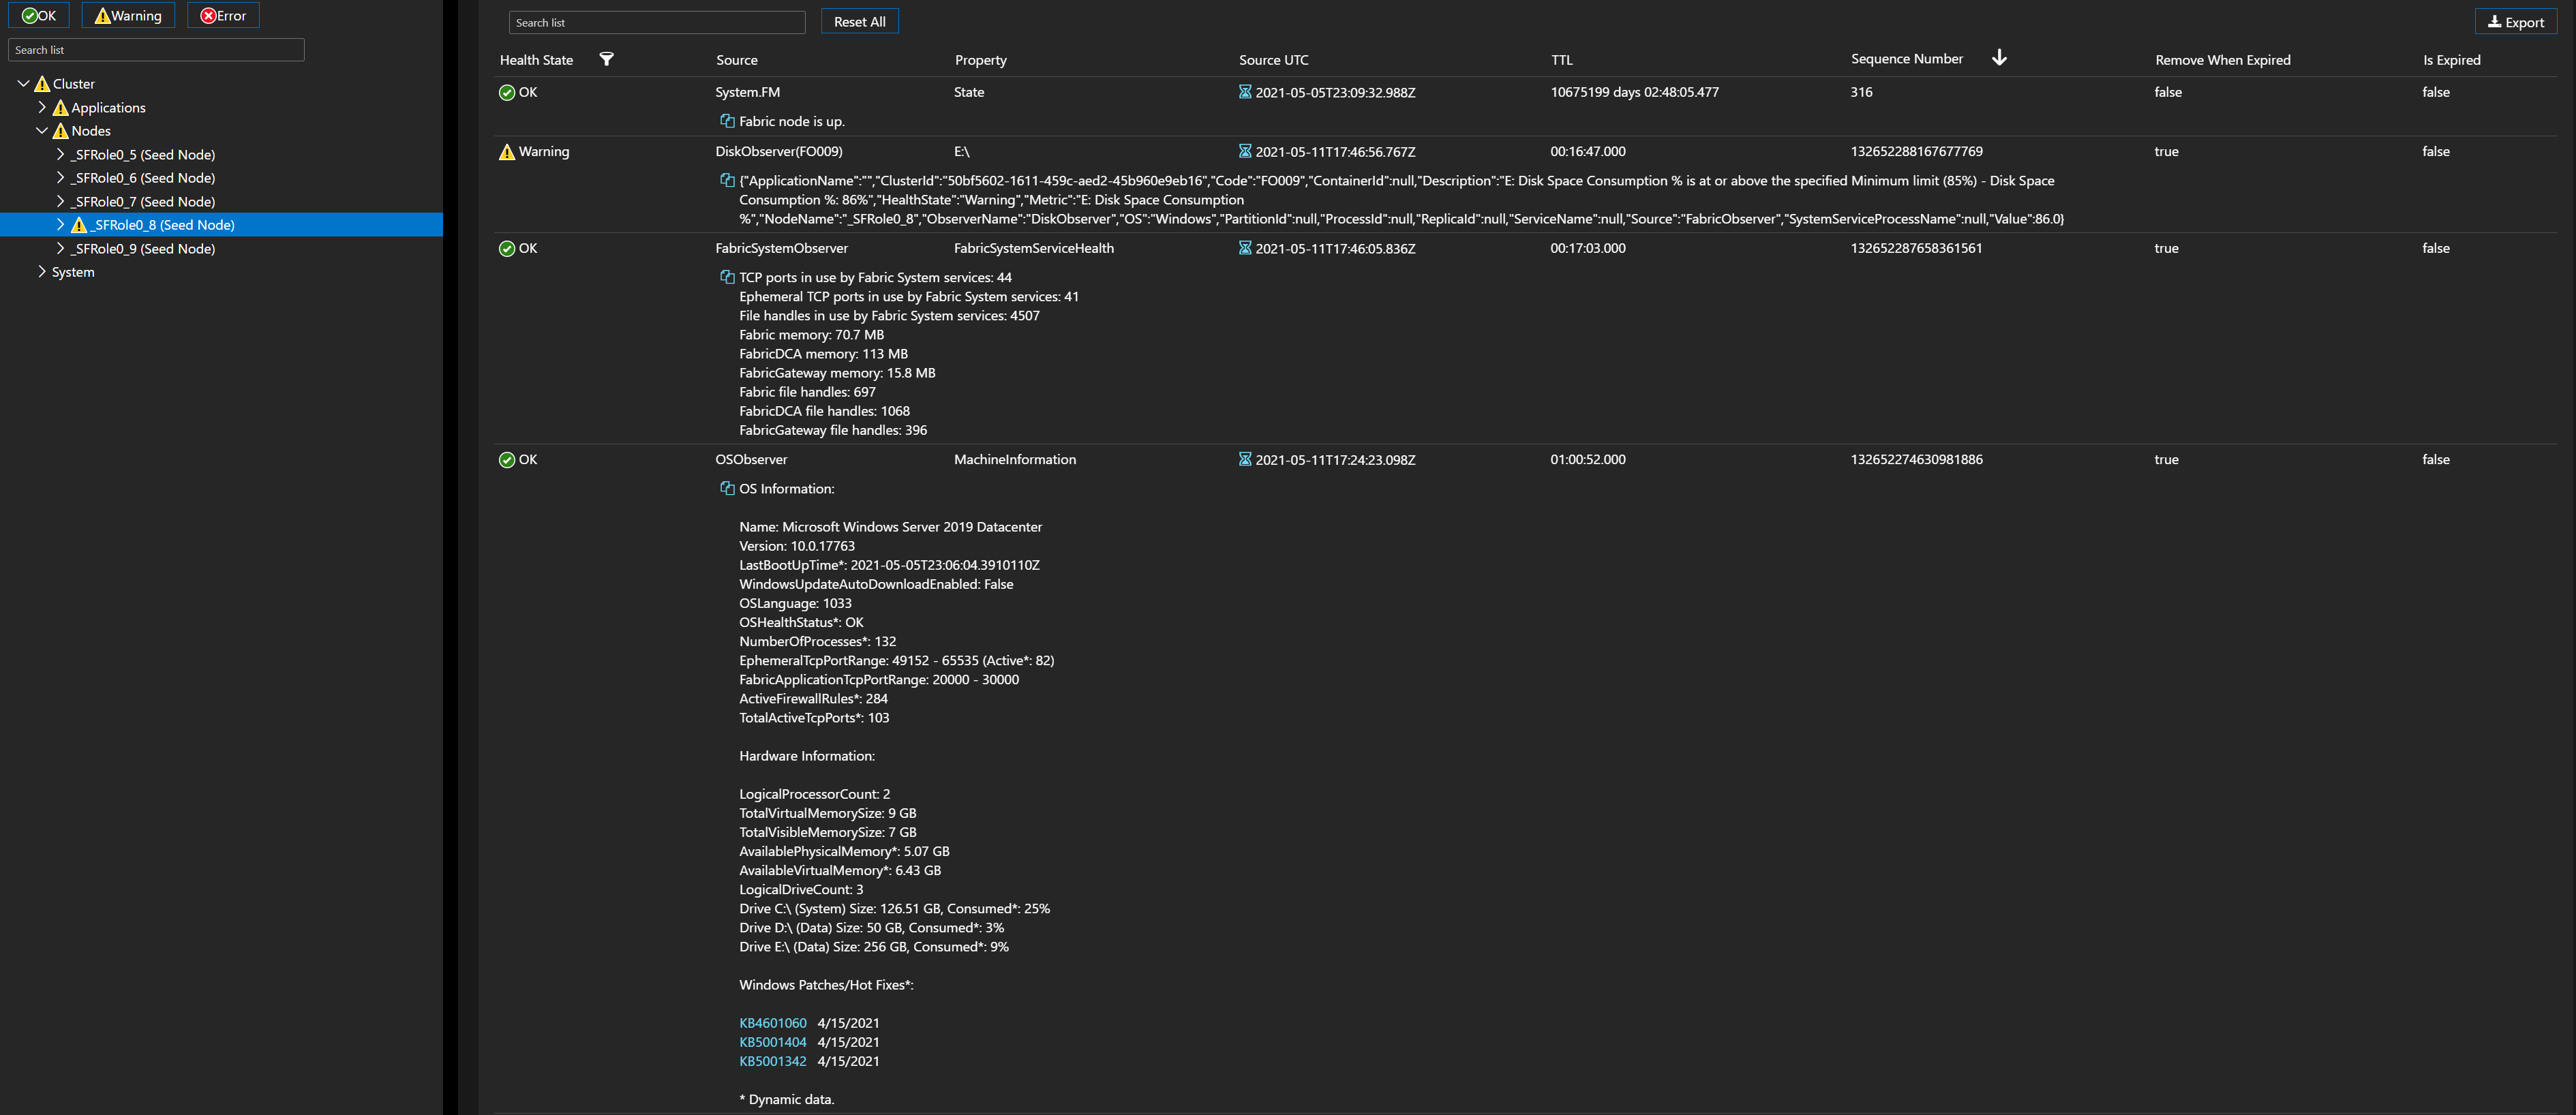
Node Level Warnings:
Node Level Machine Info:
When FabricObserver gracefully exits or updates, it will clear all of the health events it created.
FabricObserver comes with a number of Observers that run out-of-the-box. Observers are specialized objects that monitor, point in time, specific resources in use by user service processes, SF system service processes, containers, virtual/physical machines. They emit Service Fabric health reports, diagnostic telemetry and ETW events, then go away until the next round of monitoring. The resource metric thresholds supplied in the configurations of the built-in observers must be set to match your specific monitoring and alerting needs. These settings are housed in Settings.xml and ApplicationManifest.xml. The default settings are useful without any modifications, but you should design your resource usage thresholds according to your specific needs.
When a Warning threshold is reached or exceeded, an observer will send a Health Report to Service Fabric's Health management system (either as a Node or Application Health Report, depending on the observer). This Warning state and related reports are viewable in SFX, the Service Fabric EventStore, and Azure's Application Insights/LogAnalytics/ETW, if enabled and configured.
Most observers will remove the Warning state in cases where the issue is transient, but others will maintain a long-running Warning for applications/services/nodes/security problems observed in the cluster. For example, high CPU usage above the user-assigned threshold for a VM or App/Service will put a Node into Warning State (NodeObserver) or Application Warning state (AppObserver), for example, but will soon go back to Healthy if it is a transient spike or after you mitigate the specific problem :-). An expiring certificate Warning from CertificateObsever, however, will remain until you update your application's certificates (Cluster certificates are already monitored by the SF runtime. This is not the case for Application certificates, so use CertificateObserver for this, if necessary).
Read more about Service Fabric Health Reports
FO ships with both an Azure ApplicationInsights and Azure LogAnalytics telemetry implementation. Other providers can be used by implementing the ITelemetryProvider interface.
For more information about the design of FabricObserver, please see the Design readme.
Note: By default, FO runs as NetworkUser on Windows and sfappsuser on Linux. If you want to monitor SF service processes that run as elevated (System) on Windows, then you must also run FO as System on Windows. There is no reason to run as root on Linux under any circumstances (see the Capabilities binaries implementations, which allow for FO to run as sfappsuser and successfully execute specific commands that require elevated privilege).
For Linux deployments, we have ensured that FO will work as expected as normal user (non-root user). In order for us to do this, we had to implement a setup script that sets Capabilities on three proxy binaries which can only run specific commands as root.
When a new version of FabricObserver ships, often (not always) there will be new configuration settings, which requires customers to manually update the latest ApplicationManifest.xml and Settings.xml files with their preferred/established settings (current). In order to remove this manual step when upgrading, we wrote a simple tool that will diff/patch FO config (XML-only) automatically, which will be quite useful in devops workflows. Please try out XmlDiffPatchSF and use it in your pipelines or other build automation systems. It should save you some time.
FO is composed of Observer objects (instance types) that are designed to observe, record, and report on several machine-level environmental conditions inside a Windows or Linux (Ubuntu) VM hosting a Service Fabric node.
Here are the current observers and what they monitor:
| Resource | Observer |
|---|---|
| Application (services) resource usage health monitoring across CPU, File Handles, Memory, Ports (TCP), Threads | AppObserver |
| Looks for dmp and zip files in AppObserver's MemoryDumps folder, compresses (if necessary) and uploads them to your specified Azure storage account (blob only, AppObserver only, and still Windows only in this version of FO) | AzureStorageUploadObserver |
| Application (user) and cluster certificate health monitoring | CertificateObserver |
| Container resource usage health monitoring across CPU and Memory | ContainerObserver |
| Disk (local storage disk health/availability, space usage, IO) | DiskObserver |
| SF System Services resource usage health monitoring across CPU, File Handles, Memory, Ports (TCP), Threads | FabricSystemObserver |
| Networking - general health and monitoring of availability of user-specified, per-app endpoints | NetworkObserver |
| CPU/Memory/File Handles(Linux)/Firewalls(Windows)/TCP Ports usage at machine level | NodeObserver |
| OS/Hardware - OS install date, OS health status, list of hot fixes, hardware configuration, AutoUpdate configuration, Ephemeral TCP port range, TCP ports in use, memory and disk space usage | OSObserver |
| Another resource you find important | Observer that you implement |
To learn more about the current Observers and their configuration, please see the Observers readme.
Just observe it.
