-
Notifications
You must be signed in to change notification settings - Fork 0
/
bioinformatics.qmd
73 lines (49 loc) · 2.45 KB
/
bioinformatics.qmd
1
2
3
4
5
6
7
8
9
10
11
12
13
14
15
16
17
18
19
20
21
22
23
24
25
26
27
28
29
30
31
32
33
34
35
36
37
38
39
40
41
42
43
44
45
46
47
48
49
50
51
52
53
54
55
56
57
58
59
60
61
62
63
64
65
66
67
68
69
70
71
72
73
---
title: "Bioinformatics Projects"
title-block-banner: true
---
:::: columns
:::{.column width="55%"}
The analysis of RNA-Seq data involves two distinct parts. The first one needs the use of servers or HPC (high performance computers) and has to do with quality control. pre-processing, alignment-mapping (usually with the STAR software) and counting (can be done using RSEM software). The second one is called downstream analysis and this part involves differential gene expression, gene sets analysis, etc. To see how to do the downstream analysis click [here](https://pipaber.github.io/RNA-Seq/){target=_blank}
:::
:::{.column width="5%"}
:::
:::{.column width="40%"}

:::
::::
---
:::: columns
:::{.column width="40%"}

:::
:::{.column width="5%"}
:::
:::{.column width="55%"}
Epigenetics is the study of how your behaviors and environment can cause changes that affect the way your genes work. Unlike genetic changes, epigenetic changes are reversible and do not change your DNA sequence, but they can change how your body reads a DNA sequence (CDC,2024). To learn how to analyze 450k Illumina Arrays and Whole Genome Bisulfite Sequencing data click [here](https://pipaber.github.io/Epigenomics/){target=_blank}
:::
::::
---
:::: columns
:::{.column width="55%"}
In recent years the integration of *Omics* data has become important to understand the biological procesess more broadly.
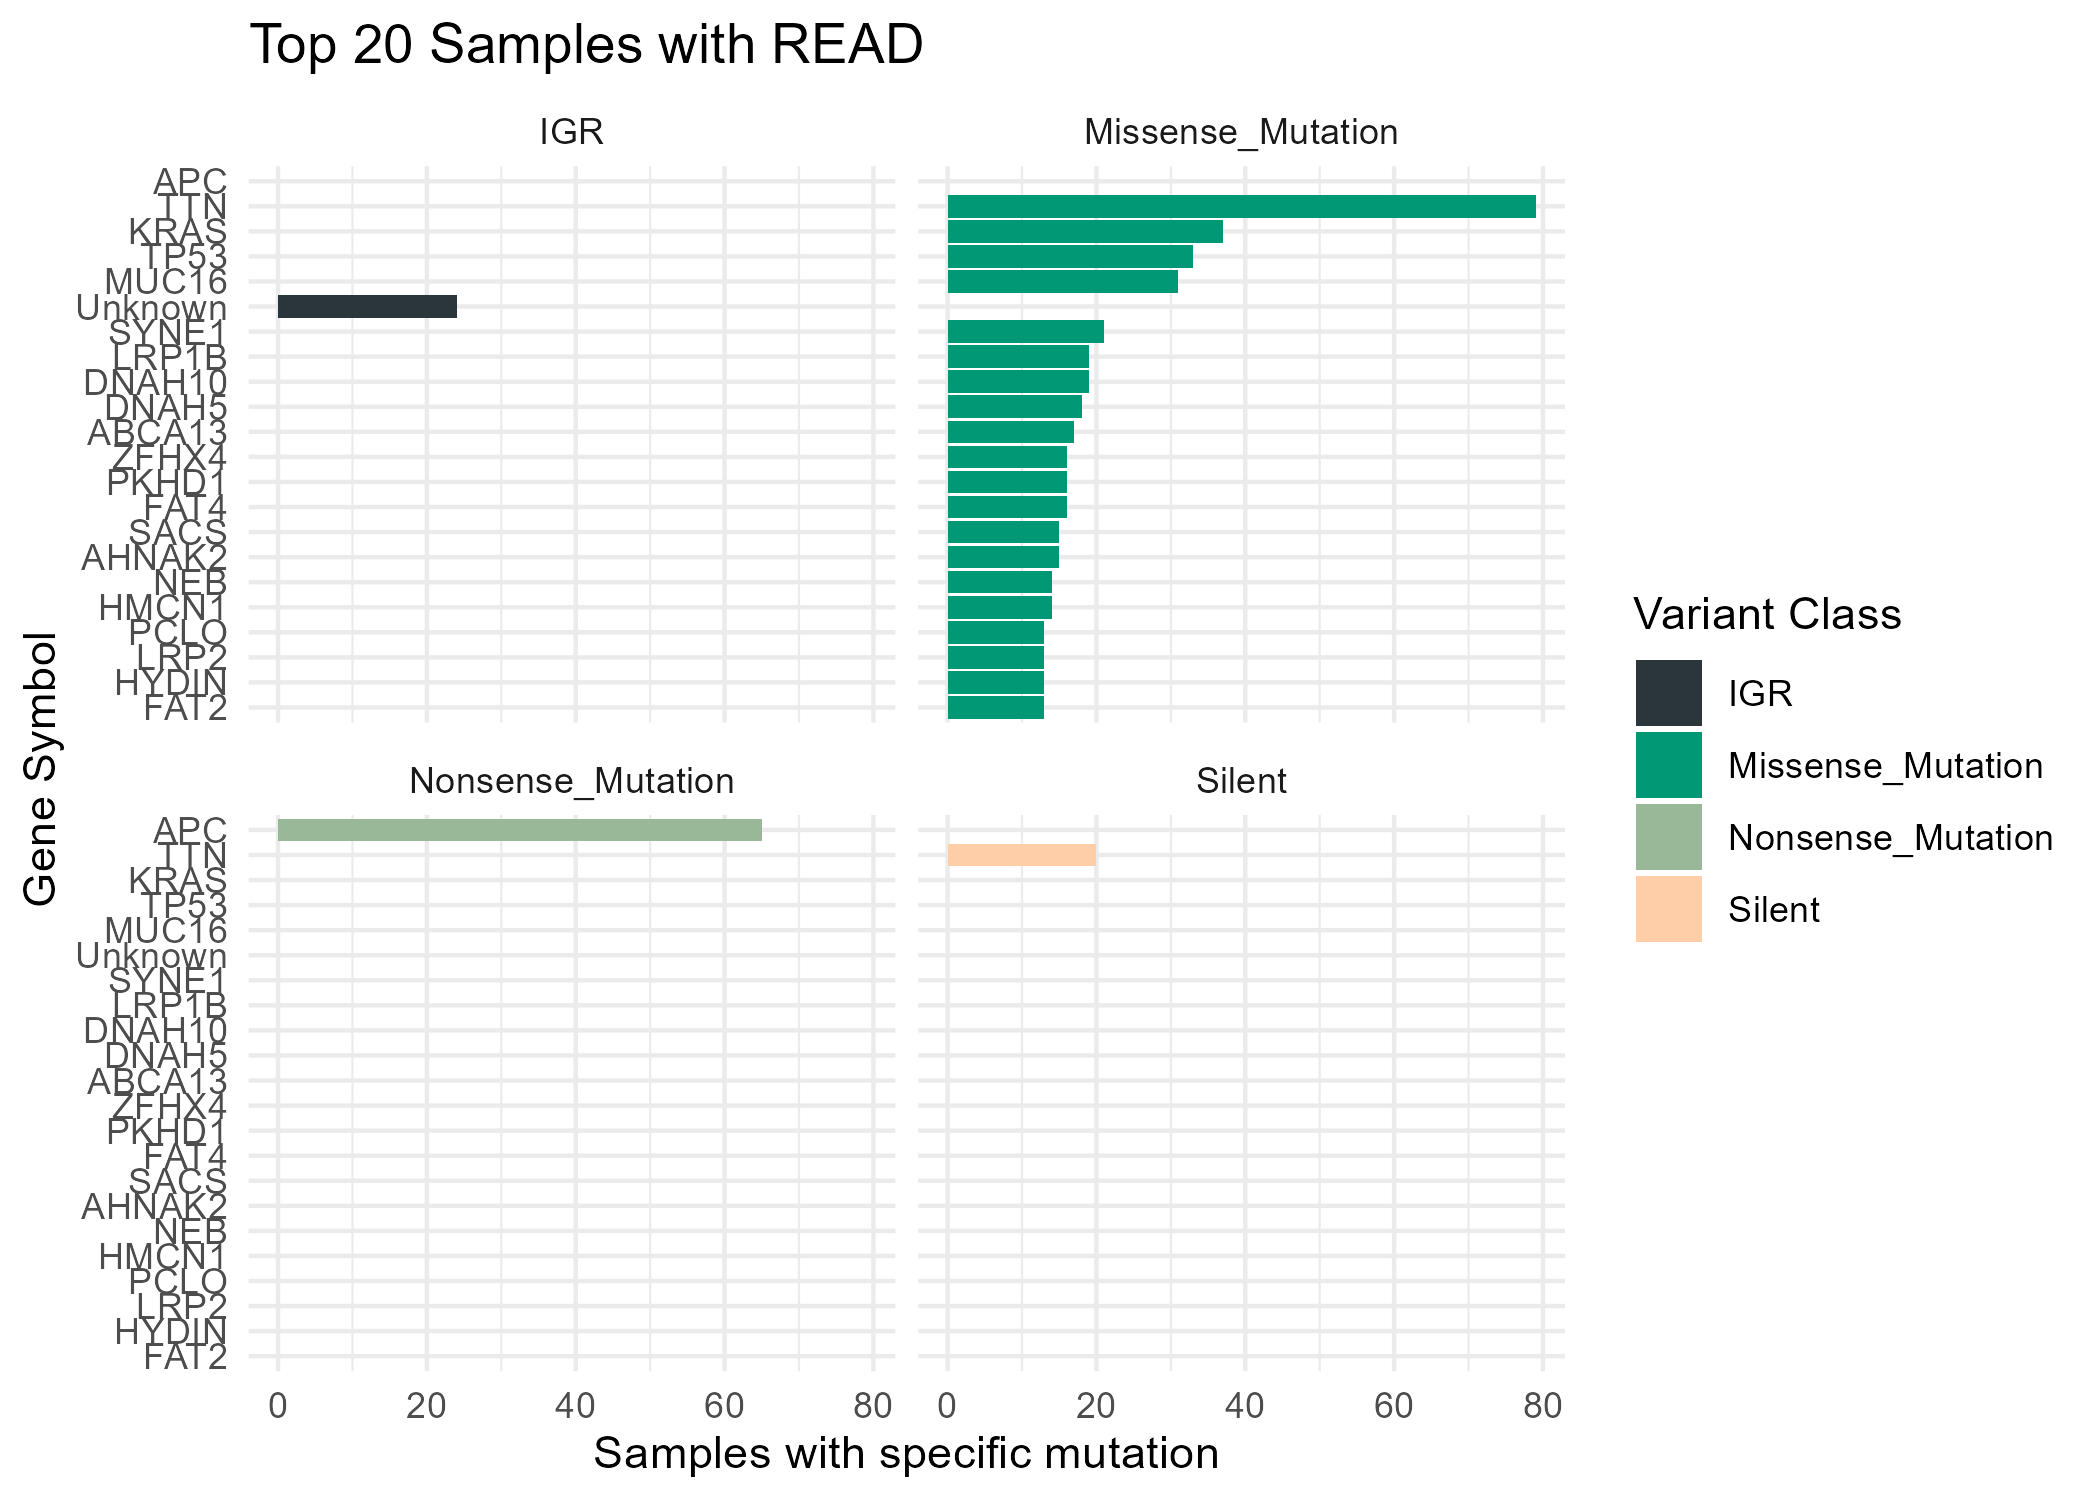
To learn how to use the GWAS Catalog with ChIP-Seq data or how to retrieve and analyze data from The Cancer Genome Atlas (TCGA) click [here](https://pipaber.github.io/Multi-omics/){target=_blank}
:::
:::{.column width="5%"}
:::
:::{.column width="40%"}

:::
::::
---
:::: columns
:::{.column width="40%"}

:::
:::{.column width="5%"}
:::
:::{.column width="55%"}
An example of a proper use of interactive plots on a RNA-Seq data report can be founded [here](https://github.com/pipaber/Omics-Potfolio){target=_blank}.
> This repository doesn't have any code, is only to showcase what is possible using Quarto and Bioconductor
:::
::::