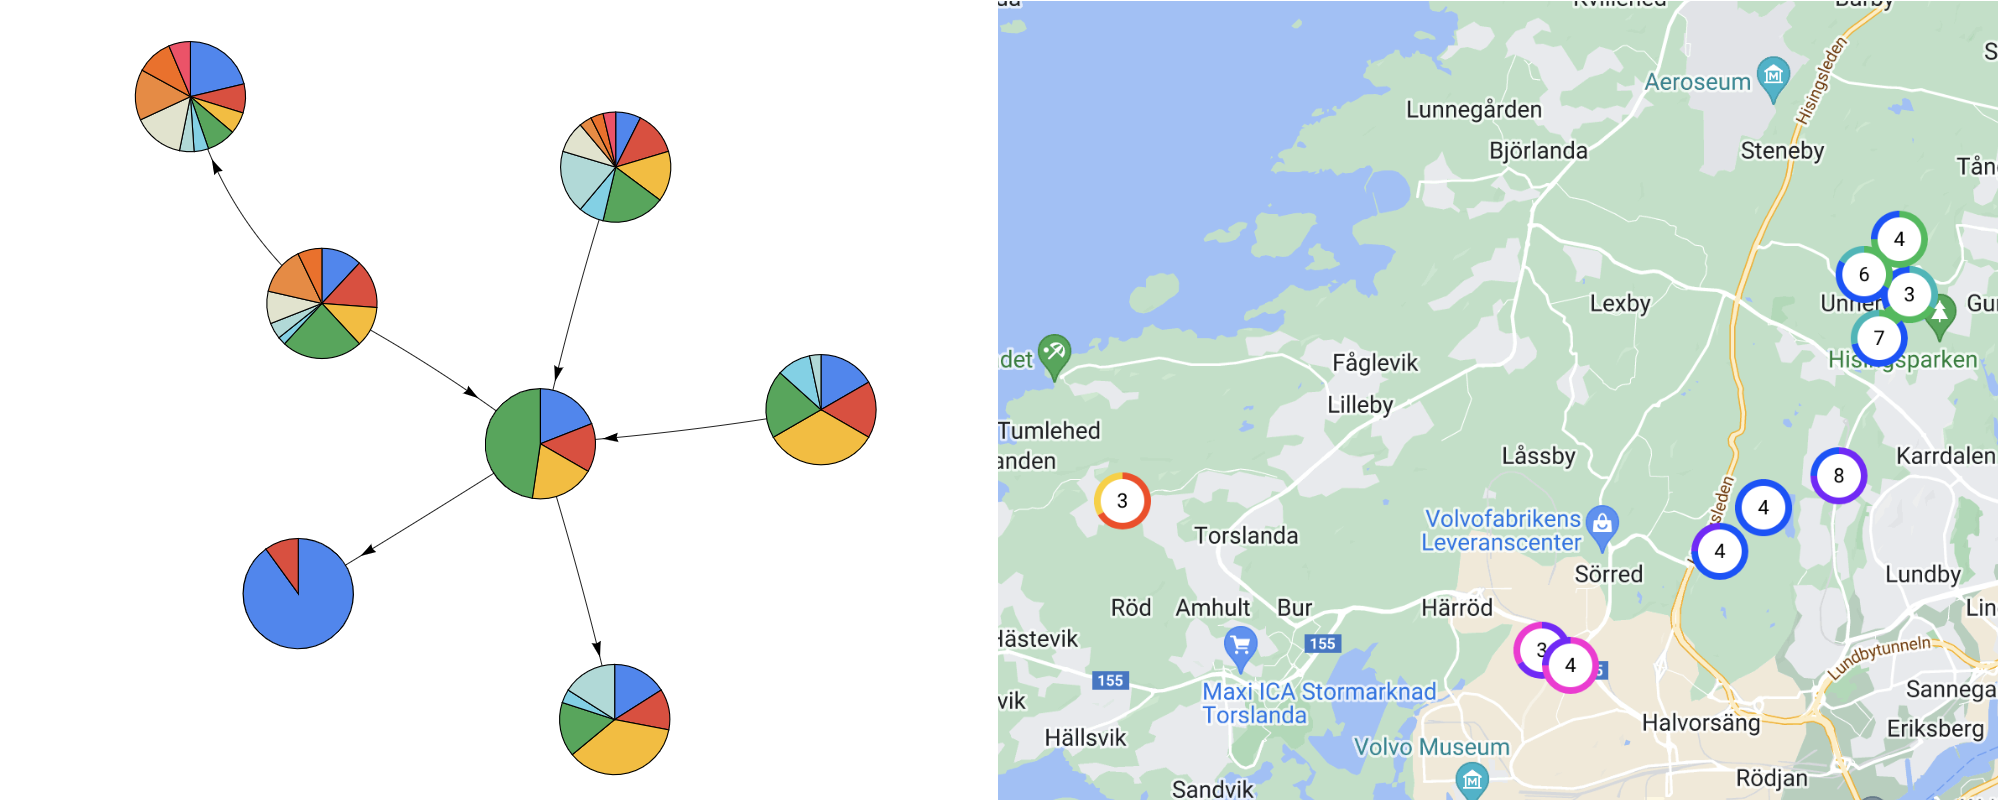
This project creates simple svg pie and doughnut charts for infographics like graphs and others.
If you are going to use simple diagram in not react project, please check simple-pie out.
simple-pieandreact-simple-piepackages are parts of the simple-pie-project repo
Some time ago I had to integrate a network graph. And the every node of the network graph would be tiny pie chart. The network graph library doesn't support anything else except png or svg as node inner content. So, it is not very nice idea to keep a bunch of png or svg files for every case of data distribution. And for obvious reasons it is not possible to use HighCharts, Chart.js or other data visualization library. (Perhaps it would work with d3, but I'm not sure, it is an overkill to keep such big library for the such small purpose)
Well the simple-pie does exactly this thing. It generates tiny svg pie which can be integrated into network graph or
map or any other case, when you can't use data-visualization libraries.
npm install react-simple-pie --save

# or

yarn add react-simple-pieimport React from 'react';
import {SimplePie, SimpleDoughnut} from "react-simple-pie"
export default function YourComponent() {
return (
<section>
<div style={{width: 200, height: 200}}>
<SimpleDoughnut values={[1, 2, 1, 2]} />
</div>
<div style={{width: 200, height: 200}}>
<SimpleDoughnut values={[1, 1, 1]} borderWidth={4} borderColor="green" />
</div>
</section>
);
}
⚠️ The svgheightandwidthare100%, so it trys to extend itself to available space. Thus, you should have wrapper with dimensions for your simple-pie diagram.
export type TPieProps = {
  values: number[];
  palette?: string[];
  borderColor?: string;
  borderWidth?: number;
};

export type TDoughnutProps = TPieProps & {
  innerRadius?: number; // 0..1 - percent from outer radius
};


