Python API to get information about COVID-19 in México.
more-itertools>=6.0.0
pandas>=0.25.2
Unidecode>=1.1.1
requests==2.21.0
xlrd==1.2.0
mapsmx==0.0.3
matplotlib==3.0.3
mapclassify==2.2.0
descartes==1.1.0
pip install covidmx
The mexican Dirección General de Epidemiología has released open data about COVID-19 in México. This source contains information at the individual level such as gender, municipality and health status (smoker, obesity, etc). The package covidmx now can handle this source as default. Some variables are encoded as integers and the source also includes a data dictionary with all relevant information. When you pass clean=True (default option) returns the decoded data. You can also have access to the catalogue using return_catalogo=True and to the description of each one of the variables with return_descripcion=True. When you use some of this parameters, the API returns a tuple.
from covidmx import CovidMX

covid_dge_data = CovidMX().get_data()
raw_dge_data = CovidMX(clean=False).get_data()
covid_dge_data, catalogo_data = CovidMX(return_catalogo=True).get_data()
covid_dge_data, descripcion_data = CovidMX(return_descripcion=True).get_data()
covid_dge_data, catalogo_data, descripcion_data = CovidMX(return_catalogo=True, return_descripcion=True).get_data()
To get historical data use:
covid_dge_data = CovidMX(date='12-04-2020').get_data()Default date format is %d-%m-%Y, but you can also use a particular format with:
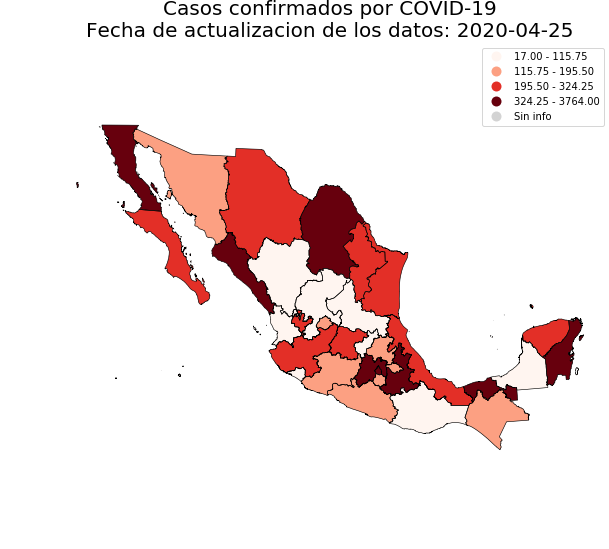
covid_dge_data = CovidMX(date='2020-04-12', date_format='%Y-%m-%d').get_data()As of version 0.3.0, covidmx includes a module to create maps of different COVID-19 status at the national and state levels, with the possibility of including municipalities (using information of the Dirección General de Epidemiologia).
from covidmx import CovidMX

dge_plot = CovidMX().get_plot()
You can check available status and available states using:
dge_plot.available_states

array(['MÉXICO', 'CIUDAD DE MÉXICO', 'TAMAULIPAS', 'BAJA CALIFORNIA',
       'YUCATÁN', 'GUERRERO', 'BAJA CALIFORNIA SUR', 'JALISCO',
       'NUEVO LEÓN', 'SONORA', 'VERACRUZ DE IGNACIO DE LA LLAVE',
       'PUEBLA', 'CAMPECHE', 'GUANAJUATO', 'SAN LUIS POTOSÍ',
       'MICHOACÁN DE OCAMPO', 'COAHUILA DE ZARAGOZA', 'QUERÉTARO',
       'AGUASCALIENTES', 'TABASCO', 'HIDALGO', 'ZACATECAS', 'DURANGO',
       'CHIHUAHUA', 'CHIAPAS', 'SINALOA', 'QUINTANA ROO', 'MORELOS',
'TLAXCALA', 'NAYARIT', 'OAXACA', 'COLIMA'], dtype=object)dge_plot.available_status
['confirmados', 'negativos', 'sospechosos', 'muertos']To plot a national map just use:
dge_plot.plot_map(status='confirmados')If you want to include municipalities use:
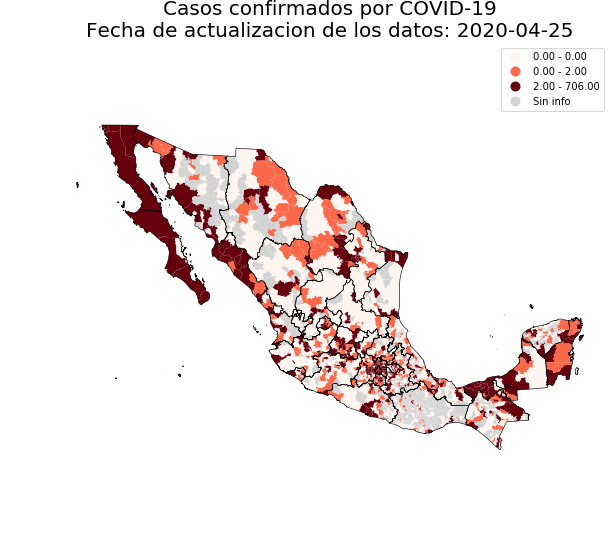
dge_plot.plot_map(status='confirmados', add_municipalities=True)You can pass a particular state filling the state argument with a valid name included in the available_states attribute:
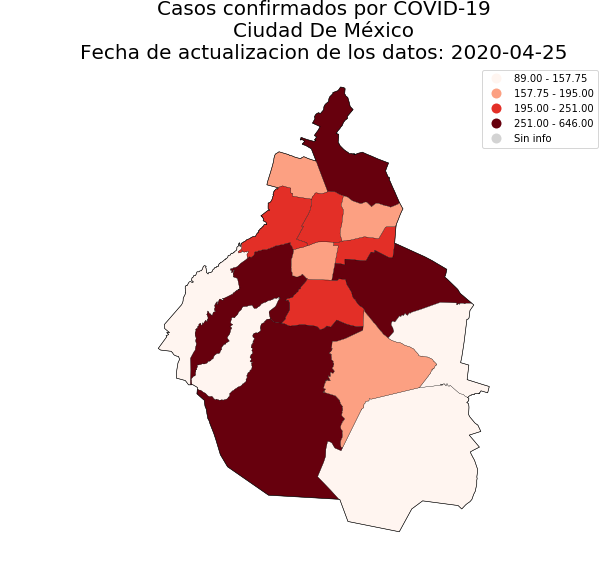
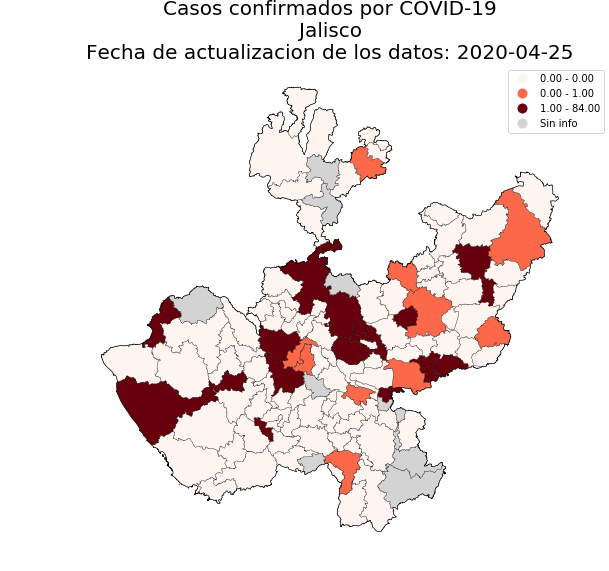
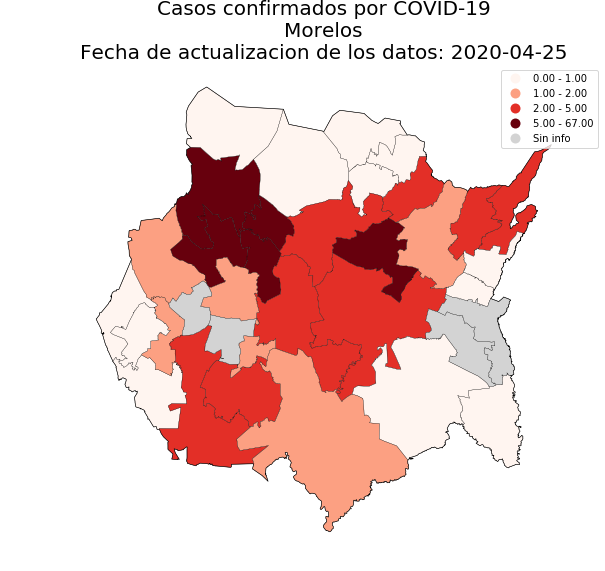
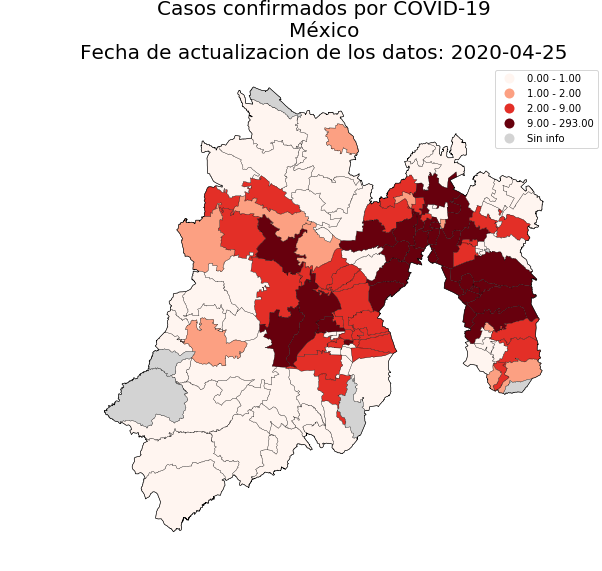
dge_plot.plot_map(status='confirmados', state='CIUDAD DE MÉXICO', add_municipalities=True)state='CIUDAD DE MÉXICO' |
state='JALISCO' |
state='MORELOS' |
state='MÉXICO' |
|---|---|---|---|
 |
 |
 |
 |
Finally you can plot another interest variable (according to available_status attribute):
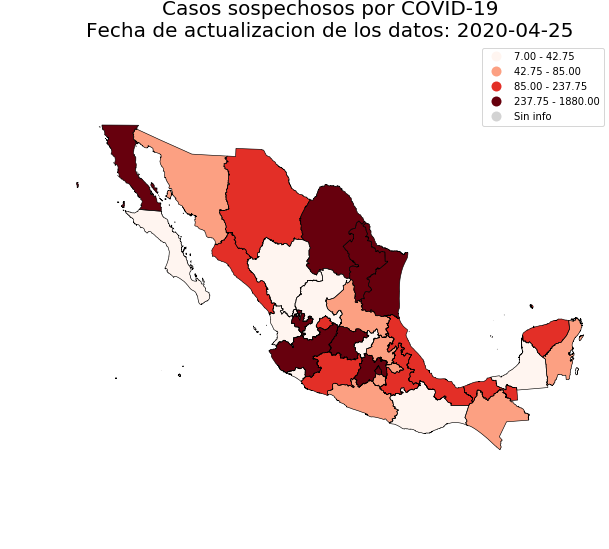
dge_plot.plot_map(status='sospechosos', add_municipalities=True)You can save your maps using save_file_name:
dge_plot.plot_map(status='sospechosos', add_municipalities=True, save_file_name='sospechosos-nacional.png')Serendipia publishes daily information of the mexican Secretaría de Salud about covid in open format (.csv). This api downloads this data easily, making it useful for task automation.
from covidmx import CovidMX

latest_published_data = CovidMX(source='Serendipia').get_data()
Then CovidMX instances a Serendipia class, searches the latest published data for both confirmed and suspects individuals and finally clean the data. Nevertheless, a more specific search can be conducted (see docs for details).
raw_data = CovidMX(source='Serendipia', clean=False).get_data()
confirmed = CovidMX(source='Serendipia', kind="confirmed").get_data()
suspects = CovidMX(source='Serendipia',kind="suspects").get_data()
particular_published_date = CovidMX(source='Serendipia', date='2020-04-10', date_format='%Y-%m-%d').get_data()- Federico Garza Ramírez (2020). covidmx: Python API to get information about COVID-19 in México. Python package version 0.3.1. https://github.com/FedericoGarza/covidmx.
- 2020-06-01
- Updated new urls from serendipia source. (Thanks to Mario Jimenez.)
- 2020-04-26.
- Includes a plot module at state and municipality leveles.
- Includes a better handling of encodings. (Thanks to Mario Jimenez.)
- 2020-04-20. The Dirección General de Epidemiología:
- Added an id column.
- Released historical information.
- Now the API can handle this changes.
- 2020-04-16. The Dirección General de Epidemiología source renamed two columns:
HABLA_LENGUA_INDI->HABLA_LENGUA_INDIG(column name and description are now homologated)OTRA_CON->OTRA_COM- Now the API can handle this change.
- Now works with
python3.5+. - Using
clean=Truereturns encoded data instead of decoded data without cleaning columns (as works in0.2.0and0.2.1).
- Minor changes to README.
- Added new source: Dirección General de Epidemiología. Default source.
- Only works with
python3.7+.
- Minor changes to README.
First realease.
- Only one source, Serendipia. Default source.


