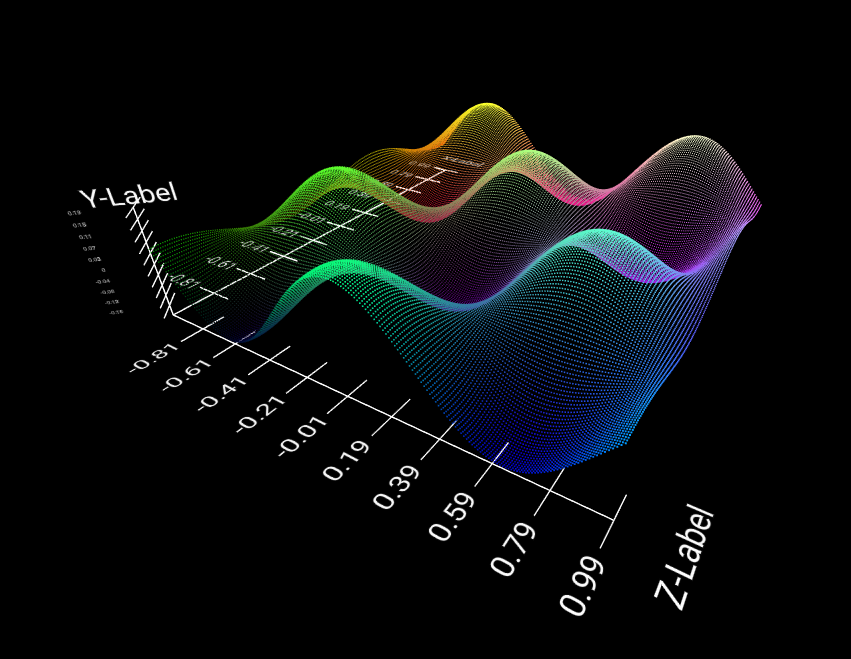
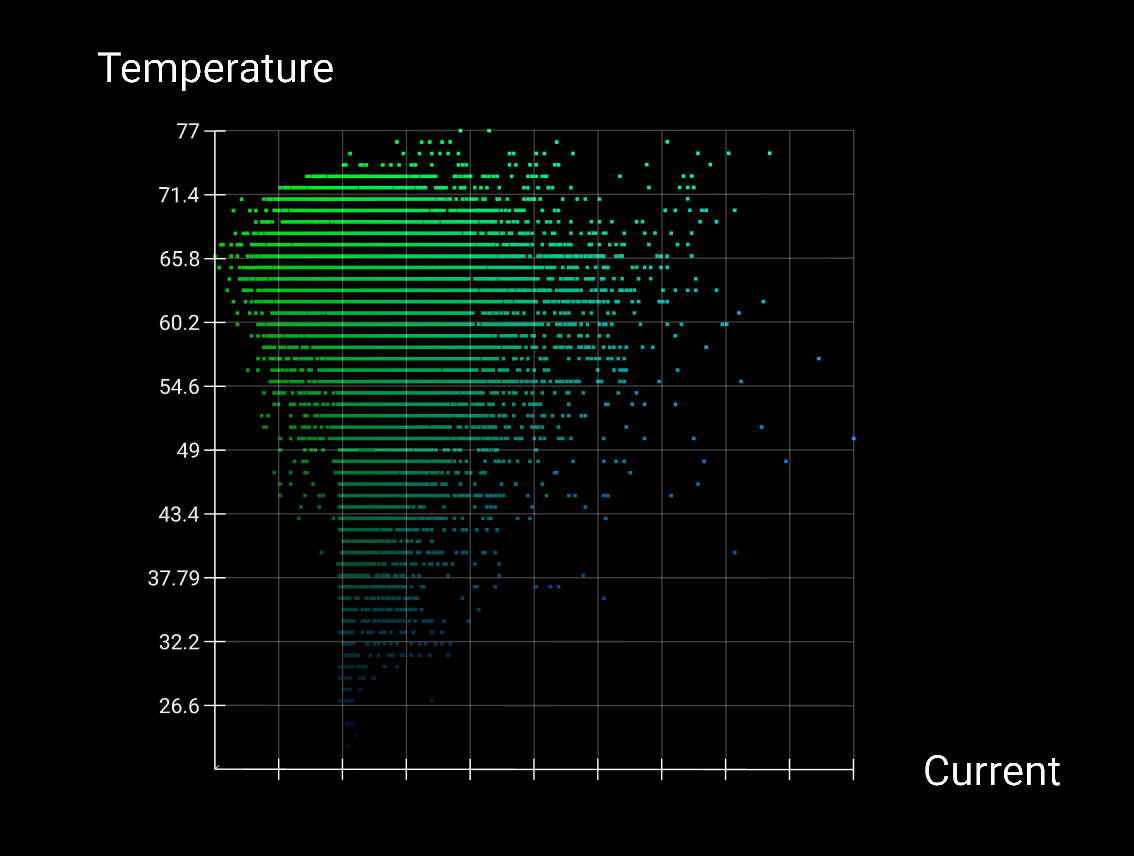
PopPlots is a feature-rich AFrame scatterplot library focused on providing a dynamic, simple, and aesthetic experience for users and developers. Using AFrame's native component structure, and handling rendering through native ThreeJS Buffer Geometries, PopPlots is able to deliver breathtaking scatterplots in the browser without an unbearable framedrop.
An example utilization can be found in the 'examples' folder or at http://poppro.net/plotexample
Using PopPlots is easy. Simply include the "plot.js" file in your project's javascript folder. Then, just point to the file in your HTML document. Done!
You must have AFrame included in your project for this library to function properly. For more info on AFrame, visit https://aframe.io/.
All plots require only one attribute, a STRINGIFIED JSON object. The specifications of this JSON can be found in the next sub-section.
An example plot is defined below,
let sceneEl = document.querySelector('a-scene');
let plotElement = document.createElement('a-entity');
plotElement.setAttribute('plot', 'data:'+JSON.stringify(data)+';scale:[10,10,10];');
sceneEl.appendChild(plotElement);
PopPlots expects your JSON to be structured as a JSON object array. The default identifiers are 'x, y, and z', each for their respective axis.
For Example,
[

    {
      "x": 0,
      "y": 51,
      "z": 323.2
    },
    {
      "x": 1,
      "y": 15,
      "z": 13.37
    }
]
If your JSON is not structured this way, don't worry! Using the component's jsonLayout attribute you can specify any variables you desire.
[

    {
      "Whoa this works": 0,
      "NoNeedToChange": 51,
      "But/Defaults_Are-Nice": 323.2
    }
]
Refer to the "Attributes" section for more info on this process.
Attributes are what allow you to customize each plot easily and dynamically, and are standard with all AFrame components.
PopPlot attributes can be accessed just like any other AFrame component attribute. Some attributes should be set when the plot is created; however, many have live-update dynamic capability.
A typical attribute would be defined like such:
plotElement.setAttribute('plot', 'AttributeName: DesiredValue');
| Name | Default | Purpose | Dynamic |
|---|---|---|---|
| data | undefined | Holds a stringified JSON object that defines plot data | false |
| scale | [2, 2, 2] | Scale of the graph in AFrame units for each axis | false |
| denomCount | 10 | Number of denominators that should be drawn per axis | false |
| enableAxis | true | Toggle the axis | true |
| enableLabels | false | Toggle axis labels | true |
| enableDenom | false | Toggle denominators | true |
| enableGrid | false | Toggle a grid that partitions the plot | true |
| enableDenomLabels | false | Toggle denominator labels that display plot axis value | true |
| enableCamera | false | Enables the library to take control of the scene rigged-camera with id #rig | true |
| enableRaycasting | false | Enables the user to define a function plotRaycaster which returns data for currently-hovered plot node | true |
| xGradient | ['#000000', '#FF0000'] | Color gradient along x-axis | true |
| yGradient | ['#000000', '#00FF00'] | Color gradient along y-axis | true |
| zGradient | ['#000000', '#0000FF'] | Color gradient along z-axis | true |
| graphColor | 'FFFFFF' | Color of all UI plot elements such as label & axis | false |
| particleSize | 0.0025 | Size factor of each data-point in the plot. This scale dynamically with plot size | false |
| animationSpeed | 0.1 | The speed of lerp animations when toggling between 2D and 3D views (set to 1 for no animations) | true |
| activeCamera | 'main' | Allows you to choose if the graph shows full 3D of just 2D. Options are: main, camXY, camXZ, camYZ | true |
| labels | ['X-Axis', 'Y-Axis', 'Z-Axis'] | UI Axis label name. This is what the user sees, so purely cosmetic. | false |
| jsonLayout | ['x','y','z'] | Allows you to define custom JSON object variable names when loading in your JSON file | false |
enableRaycasting allows the user to get information about plot points that the user has currently selected. This attribute is known to cause a notable FPS drop when scrolling over large datasets.
The enableRaycasting attribute was designed to be extremely flexible while giving you as much control over your plot as possible.
To use this attribute you must first set it to true using code such as,
plotElement.setAttribute('plot', 'enableRaycasting: true');
After the attribute has been enabled, you should create a function with three parameters named "plotRaycaster",
function plotRaycaster(vals, names, index) {

}
The attribute will automatically 'highlight' any node that is currently being hovered over by inverting its color. This effect will be undone after the node has been deselected.
Each parameter holds the following data,
- vals: A javascript object with parameters x, y, and z. Holds the value of the x, y, and z datapoints at the hovered node.
{x: xValue, y: yValue, z: zValue}
- names: A javascript object with the names of the x, y, and z axis labels.
{x: xAxisName, y: yAxisName, z: ZAxisName}
- index: An integer which represents the node's location in the original JSON array provided to the plot.
3233 //Hovered node's data can be found at index 3233 of the data.json file or JSON object.
The function is called once every time a new node is selected by the user and once when all nodes have been deselected.
enableCamera allows the user to take advantage of PopPlot's built in camera animation system when selecting plot 'modes'.
enableCamera can be set to either true or false, and is by default false. Its effects are only noticed when live-updating the 'activeCamera' attribute value. When the activeCamera attribute value is updated, the camera will 'swing' to a head-on view of the 2D plot. When 3D plot viewing is enabled, the Camera will swing back to its former free-roam location.
Best results from this attribute will be observed from a cube plot which has standard scaling across all axes.
For this attribute to perform as expected, your scene must include a camera rig with the id #rig. Code for defining such a camera rig can be seen below.
<a-entity id="#rig" position="5 5 15" look-controls wasd-controls="fly:true">
  <a-entity camera="active:true" aframe-injected data-aframe-inspector-original-camera></a-entity>
</a-entity>
activeCamera will allow you to 'collapse' the scatterplot into variations of 2D and 3D views. All labels and graphical indicators are dynamically updated to match the new plot.
This attribute has four values it can be assigned: main, camXY, camXZ, and camYZ. Their properties are defined below.
- main - Renders a 3D view of the graph (default state)
- camXY - renders a 2D view of the graph for only the X and Y axes
- camXZ - renders a 2D view of the graph for only the X and Y axes
- camYZ - renders a 2D view of the graph for only the X and Y axes
Every time activeCamera's value is altered, the graph will animate to the requested state using the animationSpeed attribute's value.
Please contact [email protected] for contribution inquiries.
- Hunter Harloff - Lead Developer - Poppro
This project is licensed under the MIT License

