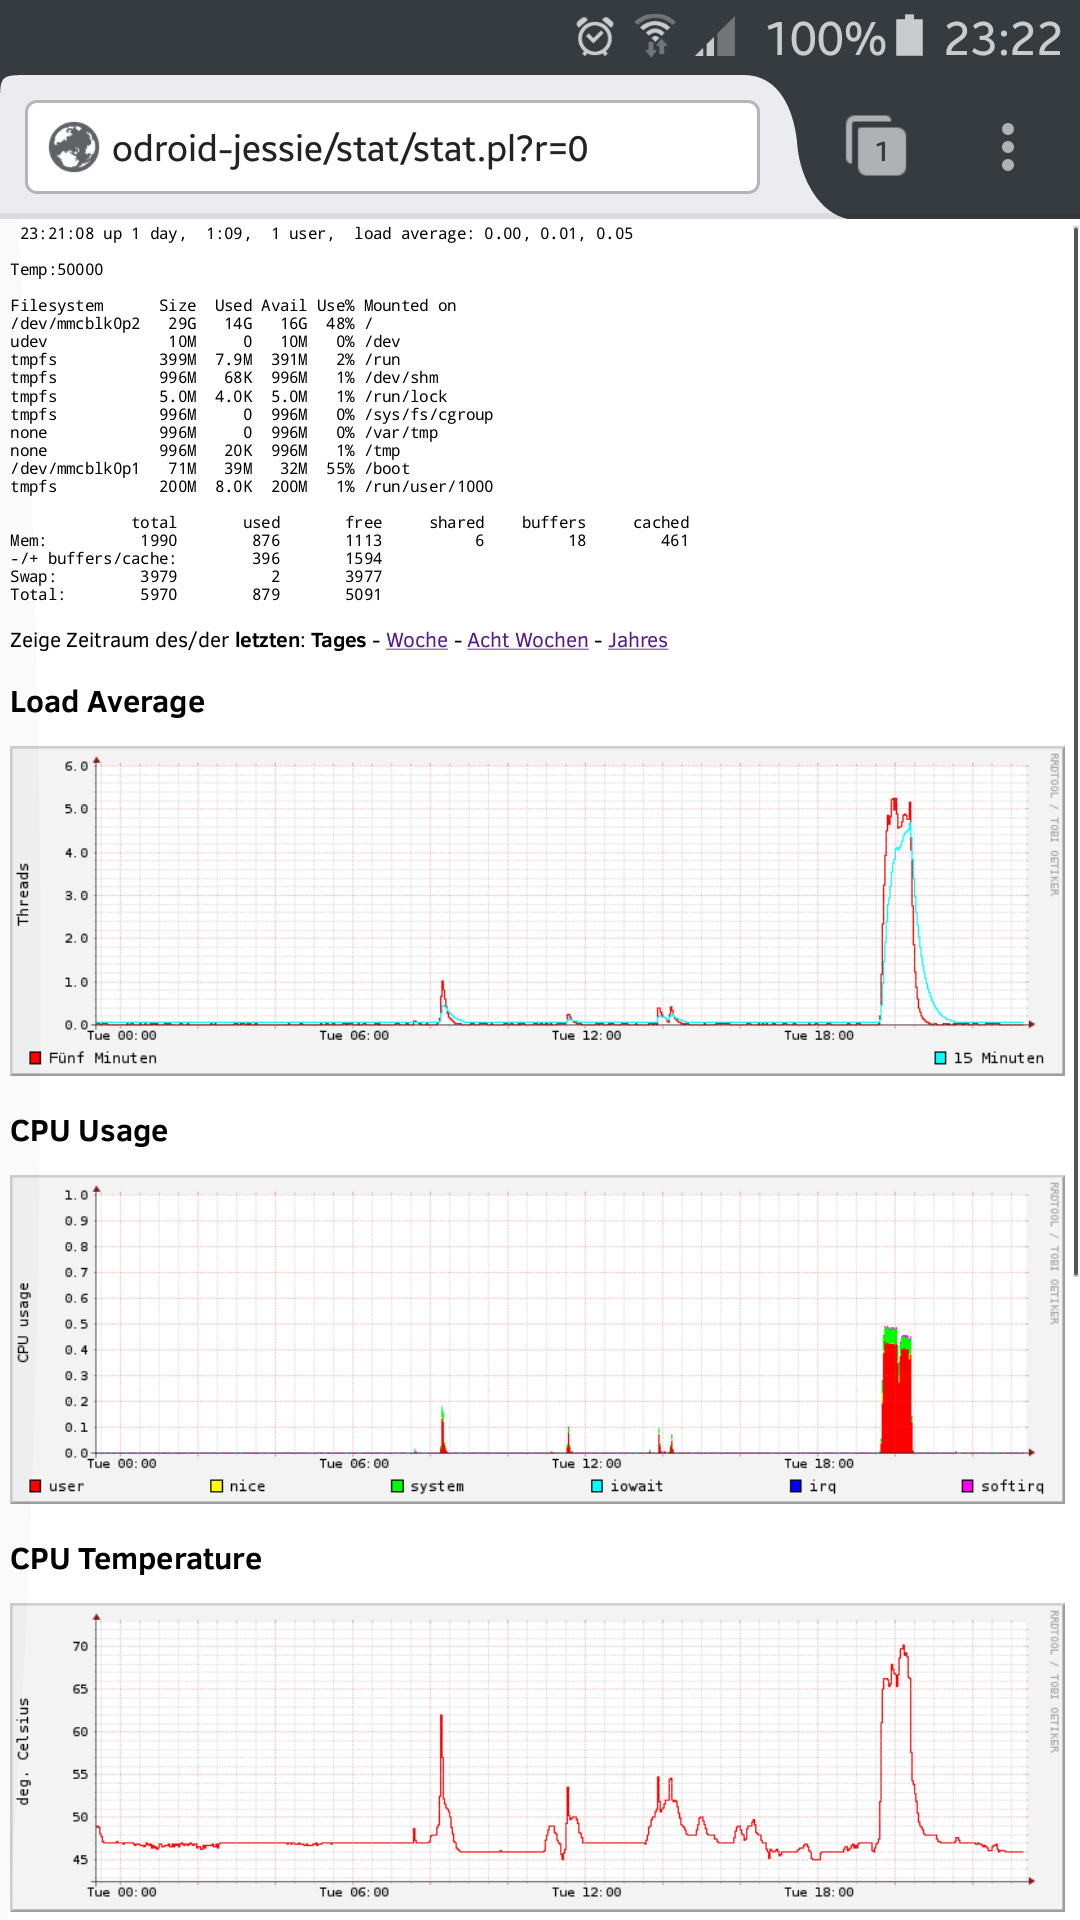
This is a tool providing a CGI page plotting system usage statistics using rrdtool. With only about 400 lines of code, it is very simple and therefore easy to understand and extend.
Currently it collects Load Average, CPU usage, Temperature, Disk I/O, Network Traffic and Memory and Swap Usage, which are plotted over a period chosen by the user at runtime.
It is build up of two parts:
- stat.pl - Perl CGI script to be called by a webserver.
- rrdupd.c - lightweight daemon collecting system usage information.
You need to have rrdtool with plotting capability installed, as well as the common tools for building C programs (i.e. make and gcc). This program should be installed in a path where your webserver is able to execute the stat.pl script via its CGI.
When these prerequisites are met, installation is done with following steps:
- Download serverstat-linux, e.g. by doing
git clone https://github.com/aandergr/serverstat-linux - You might adjust the files to fit your needs
- Build rrdupd using
make - Run
./mkrrd.shto initalize RRD databases - Adjust permissions such that your webserver is able to execute stat.pl as CGI script, able to read .rrd files and able to write/create .png files in that directory
- Run
./rrdupd
./rrdupd should be started automatically on system startup. On
debian-alike systems, this can be achieved using:
echo "start-stop-daemon -S -x /var/www/html/stat/rrdupd -c stat -b" >> /etc/rc.local
chmod +x /etc/rc.local
(Where stat is the name of the user and /var/www/html/stat the path of this software)
Also, there is a serverstat-linux.service systemctl script template in this repository.
Consult the documentation of your operating system for more information.
Now you can point your browser to the direction of your stat.pl and (hopefully) everything works. Of course it will take a few minutes until you see some data.
