TCP/UDP/ICMP latency monitoring tool. Detects network anomalies.
latencymon client tcp 10.90.1.7:9999
TCP/UDP mode requires a server running on the remote:
latencymon server tcp 0.0.0.0:9999
latencymon client icmp 10.90.1.7
In ICMP mode the tool works as a regular ping. No server is required, root permissions are required for the client.
-T, --timeout <TIMEOUT>        [default: 30]
-I, --interval <INTERVAL>      [default: 1.0]
-S, --frame-size <FRAME_SIZE>  frame size (TCP/UDP) [default: 1500]
-W, --latency-warn <WARN>
-O, --output <OUTPUT_KIND>
          output kind [default: regular] [possible values: regular, syslog, chart, ndjson, eva4_trap]
When --latency-warn option is specified (in seconds), logs only frames with latency equal or greater than the specified number.
When --output syslog option is specified, logs all messages to syslog. Useful to run the tool in the background or as a system service.
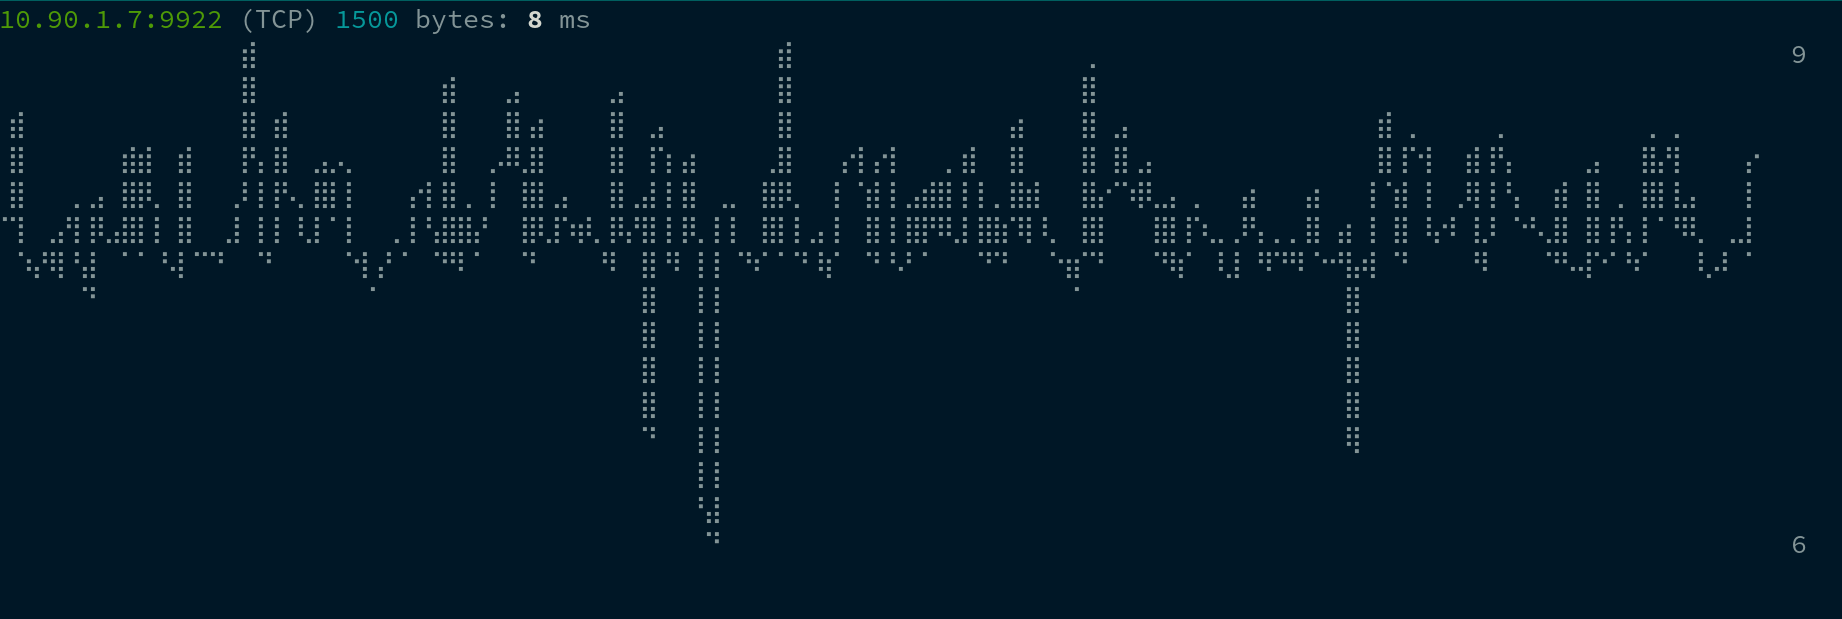
when --output chart option is specified, outputs the result as a live chart in the console
- when --output ndjson option is specified, outputs the result as ndjson in the following line format:
{"t":1703460047.4284112,"v":0.009972634}where "t" field is the event timestamp and "v" is latency in seconds. In case of errors, "v" is set to -1.
when --output eva4_trap option is specified, outputs events as EVA ICS v4 native traps.
The following additional argument with output options is required:
--output-options path=127.0.0.1:1262,oid=sensor:network/lab-stor1/latency,units=ms
where:
-
path EVA ICS trap handler input socket path
-
oid item OID to receive state
-
units (optional) latency units: s, ms, us, ns. the default is s (seconds).
