In this project, you'll:
- set up the VSCode debugger on your local machine
- learn how to use the debugger to solve problems
Click on the green button to clone the project starter.
The VSCode debugger will step through your code one line at a time, allowing you to examine each line's execution.
- Open your
settings.json- Open
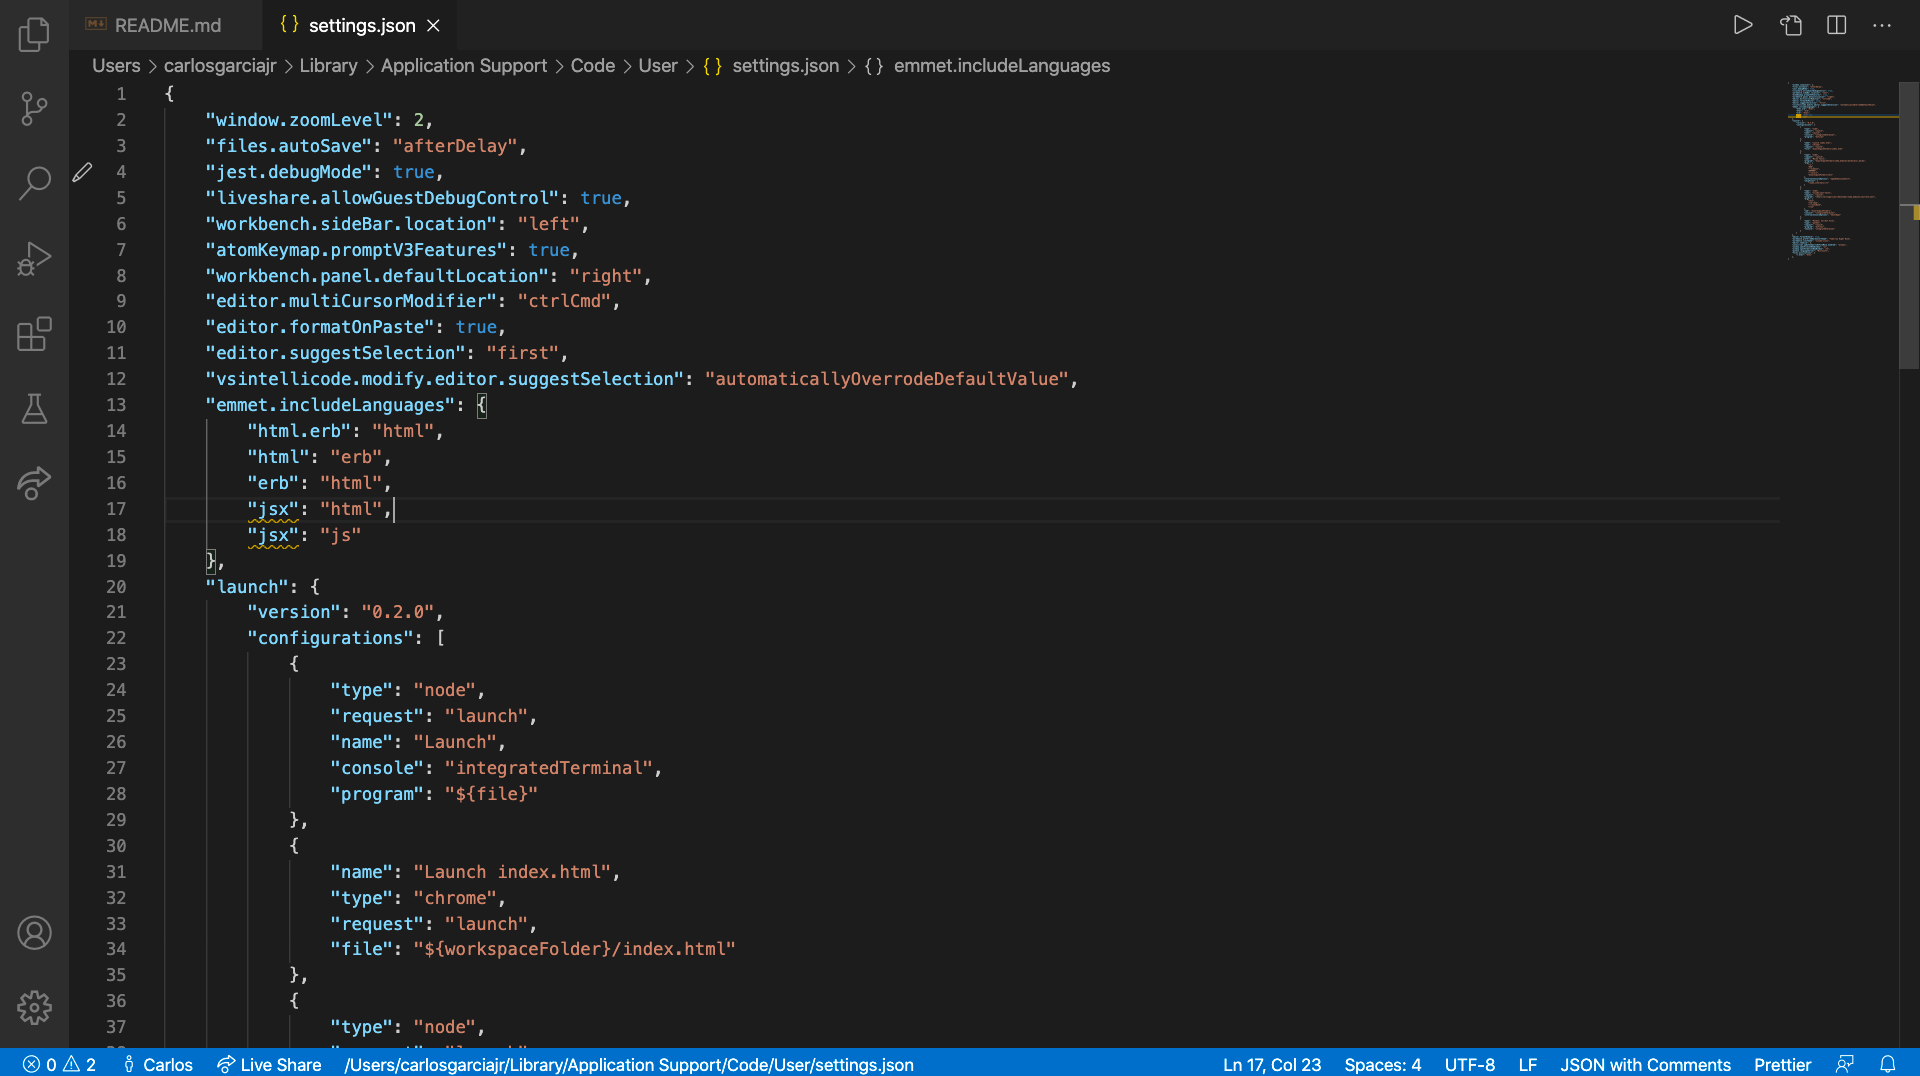
settings.jsonby doingCMD + SHIFT + P(orCTRL + Shift + Pfor Windows) and typing in settings. Make sure that you click on the option that saysOpen Setting (JSON) - You should see something like this:
- Open
- Add the following "launch" key to the settings JSON object.
"launch": {
    "version": "0.2.0",
    "configurations": [
        {
            "type": "node",
            "request": "launch",
            "name": "Launch",
            "console": "integratedTerminal",
            "program": "${file}"
        },
        {
            "type": "node",
            "request": "launch",
            "name": "Mocha Tests",
            "program": "${workspaceFolder}/node_modules/mocha/bin/_mocha",
            "args": [
                "-u",
                "bdd",
                "--timeout",
                "999999",
                "--colors",
                "${workspaceFolder}/test"
            ],
            "internalConsoleOptions": "openOnSessionStart",
            "skipFiles": [
                "<node_internals>/**"
            ]
        }
    ]
}- This will create two configurations for launching the VSCode debugger. One to test individual Node.js files called "Launch", and one to test projects with mocha set up called "Mocha Tests"
- JSON has similar syntax of a JavaScript object but one of the main differences is that all the keys must be wrapped in double quotations.
- Open the
test.jsfile in this project and click the debugging tab on the left side navigation bar (the play button with a bug). If you don't have the navigation bar all the way to the left, make sure you haveView < Appearance < Show Activity Barchecked.- Also, make sure that the dropdown option next to the green play button is
set to
Launch. Launchis the name you set to the launch configuration in thesettings.jsonfile.
- Also, make sure that the dropdown option next to the green play button is
set to
VSCode Debugging Tab Symbol:
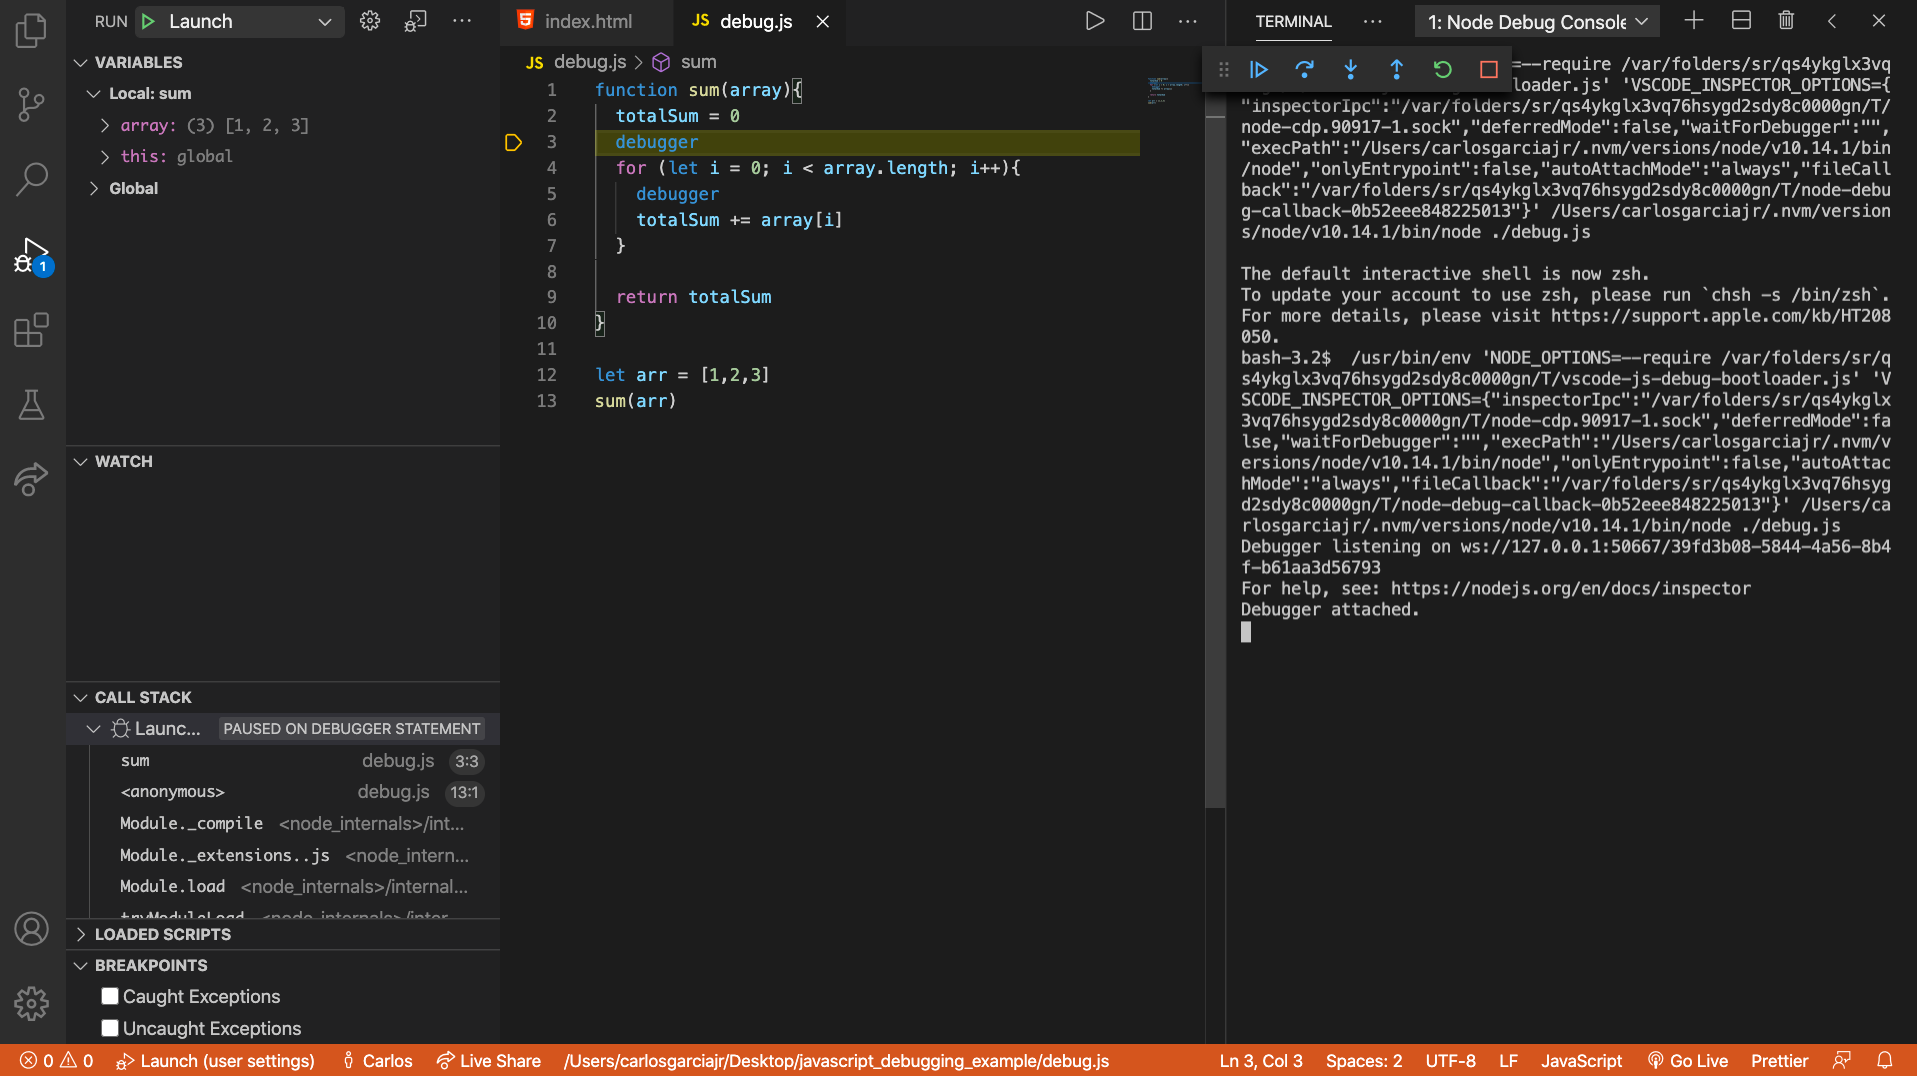
- Press the green play button and watch your code hit the debugger in
test.js.- Note: If you're testing out a function make sure that you are invoking that function.
- If you press the green play button and your screen looks similar to the one below, then you're all set! If you're having issues and you're using WSL, see the note below. If you're still having issues, call for some help!
FOR WSL USERS ONLY: Make sure you are using a VSCode window that has
[WSL: ...] in the title of the window!! Otherwise VSCode debugger will not
work. To get this title, open up your Ubuntu terminal and cd into the project
folder. Then run code .. Confirm the title of the VSCode window that opens up
and try out test.js there. Restart VSCode and try again if this still doesn't
work.
Once you're done setting up VSCode debugger on your machine, let your partner know. Once they confirm that they are also ready, you can continue on to the next phase with them. Please don't start Phase 2 until they are ready!
In this phase, you'll be using the VSCode debugger to debug four problems.
Go through each file one by one to debug all the errors. There could be multiple errors in one file, so make sure that the code behaves as you expect before moving onto the next file.
Instead of using console.log to debug, make sure to use the debugger.
If you spot the error before using the debugger, make sure to validate the
solution to the error by placing an appropriate debugger, running it, and
explaining to your partner that whatever the debugger exposes supports your
solution. Do not fix the error until you do this exercise.
Start debugging!


