A tool to log data from an Okofen Pellematic
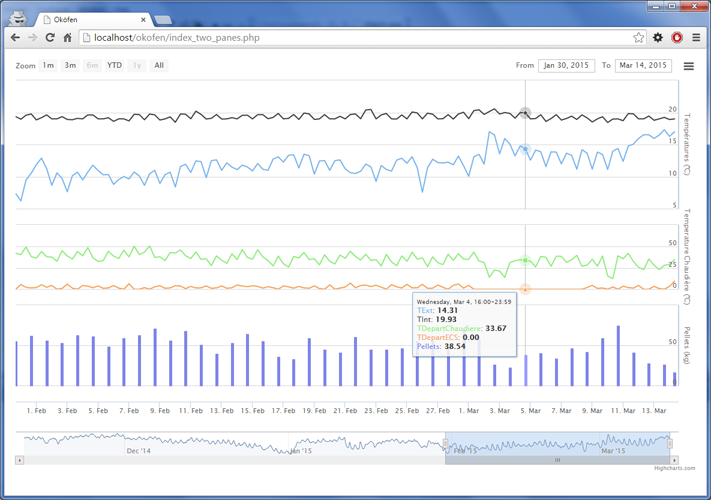
The tool will plot data gathered from the heater thanks to the files that are dumped on the USB key or grabbed from the web server.
The data is ploted thanks to HighCharts Stock (http://www.highcharts.com/stock/demo)
The aim of the project is to:
- Be able to optimize the heating cycles
- Be able to measure the pellet consumption, and be warned when the silo is getting too low
Note: the pellet consumption is measured by watching the numbers of minutes where the worm drive of the silo is on (PE1MotorRA). The concumption of the pellets is constant between two filling. The ratio is currently hardcoded.
Status:
- The project is very much in its infancy - I've managed to graph something, and to calculate the quantity of pellets that are consumed, but not much more
- I'm doing that in my free time, and there's not much of it...
- Please don't judge the code, I haven't been coding for years, I'm in product management now, and I just want to graph things, not to build a piece of art...
