Leveraging F#'s functional programming capabilities, DIKU-Canvas emphasizes:
- Immutability: All shapes and transformations are immutable, promoting a purely functional approach.
- Higher-order functions: Utilize functional constructs to create and manipulate complex shapes.
- Type Safety: Benefit from F#'s strong type system to ensure correctness and robustness.
Make an F# script, say myFirstCanvas.fsx, with a NuGet reference:
#r "nuget:DIKU.Canvas, 2.0.4"
open Canvas
open Color

let w,h = 256,256
let tree = filledRectangle green ((float w)/2.0) ((float h)/2.0)
let draw = make tree
render "My first canvas" w h draw
and run it from the command line using
dotnet fsi myFirstCanvas.fsx
This should result in a window with a green square in the top left corner on a black background.
If you want a specific version you edit the reference to be, e.g.,:
#r "nuget:DIKU.Canvas, 2.0.5-alpha8"Make a new directory, say mycanvasapp, in that directory start an F#
"Console App" project with the command:
dotnet new console -lang "F#"
(This will give you both a Program.fs file and a mycanvasapp.fsproj file.)
Add a reference to the DIKU.Canvas package with the command:
dotnet add package DIKU.Canvas
Edit Program.fs to have the content:
open Canvas
open Color

let w,h = 256,256
let tree = filledRectangle green ((float w)/2.0) ((float h)/2.0)
let draw = make tree
render "My first canvas" w h draw
Run your app with the command:
dotnet run
This should result in a window with a green square in the top left corner on a black background.
Graphic primitives may be transformed and combined in a tree structure, and the trees may be rendered to the screen or to file as a still image or an animation. DIKU-Canvas also has an interactive mode that accepts input from the keyboard and the mouse.
The collection of primitives serves as the foundation for complex geometric shapes:
- Piecewise Affine Lines: Represented as sequences of connected line segments, allowing for intricate paths and outlines.
- Circular Arcs: Defined by a center, radius, and angle, enabling precise circular structures.
- Cubic Bezier Curves: Provide control over curve definition and complexity, facilitating the design of smooth and customizable curves.
- Rectangles: Utilize coordinates for position, width, and height to draw various rectangular shapes.
- Ellipses: Create ellipses by specifying parameters that control shape and orientation.
The primitives can be transformed and combined with:
- Translation: Translate objects across the 2D plane with user-defined x and y offsets.
- Rotation: Rotate objects around a specific point, providing the angle in degrees or radians.
- Scaling: Resize objects by a given scaling factor, either uniformly or non-uniformly.
- Horizontal and Vertical Alignment: Utilize alignment functions to organize shapes horizontally or vertically, aiding in layout design.
- Layering Shapes: Combine shapes by drawing them on top of each other, allowing for the creation of intricate designs.
DIKU-Canvas has several rendering and interaction options:
- Render: Graphic trees may be rendered to the screen or a file
- Animation: Sequences of graphic trees may be rendered as an animation to the screen or a file
- Interaction: DIKU-Canvas has an interactive mode, which reacts to the user input from the keyboard or mouse and allows the programmer to update the graphic tree and render the result to the screen.
Canvas is a system for combining simple graphics primitives.
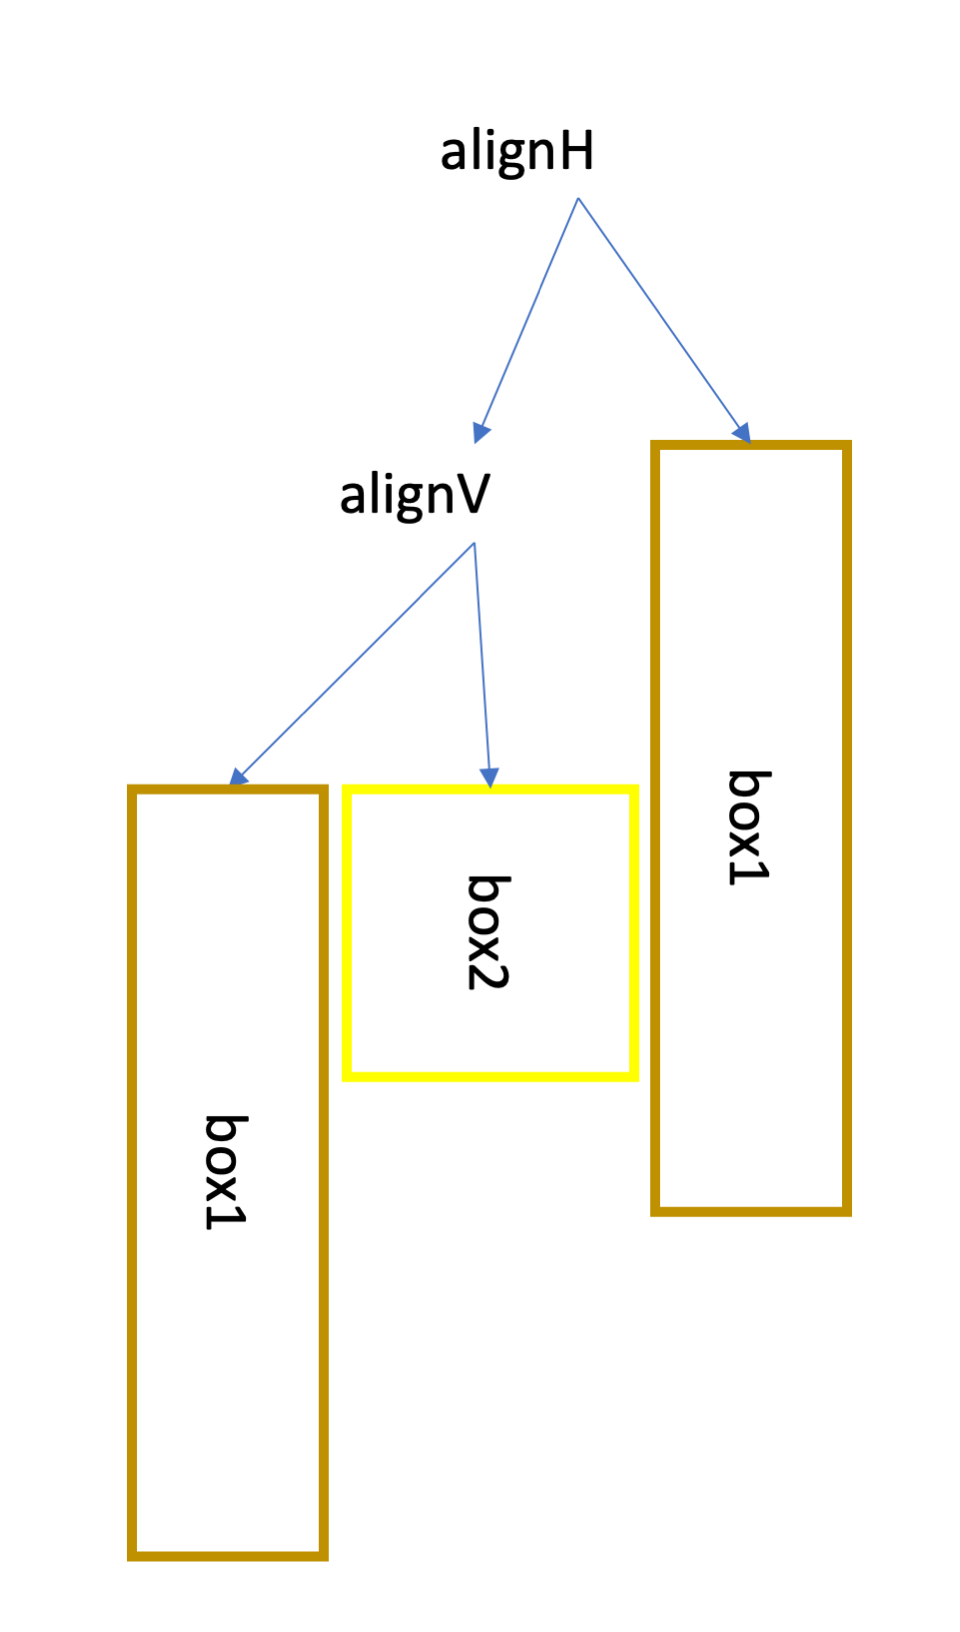
A simple graphics primitive such as a rectangle or an ellipse are leaves in a tree, that is, a single rectangle is a tree with only one node. These can be combined into trees. To illustrate how this works, consider the following figure.
The figure has been produced by rendering the following tree:
let box1 = rectangle goldenrod 1.0 20.0 80.0
let box2 = rectangle yellow 1.0 30.0 30.0
let tree = alignH (alignV box1 Right box2) Center box1
Here, two boxes are created and combined with the alignV and alignH functions. The resulting tree is depicted below.
Our functional approach allows us to reuse box1 such that it is the same goldenrod rectangle that appears twice. Such reused can be made with any tree.
Canvas can print the tree structure with toString which gives
AlignH position=0.5
∟>AlignV position=1
  ∟>Rectangle (color,stroke)=(Color DAA520FF, 1.0) coordinates=(0.0, 0.0, 20.0, 80.0)
  ∟>Rectangle (color,stroke)=(Color FFFF00FF, 1.0) coordinates=(0.0, 0.0, 30.0, 30.0)
∟>Rectangle (color,stroke)=(Color DAA520FF, 1.0) coordinates=(0.0, 0.0, 20.0, 80.0)
indentation illustrates which node is a child of which node. From the output of toString we cannot see that box1 has been reused. The function toString also gives other information, e.g., that alignH was called with the Center argument which is internally represented as the value 0.5, and likewise, Right for alignV is internally represented as the value 1.0.
The value tree can be rendered on screen by
let pict = make tree
render "Graphics tree" 75 150 pict
which opens a window on the screen showing the 3 boxes. In interactive mode, render opens a window, and the function returns, when that window is closed. The graphics tree may also be rendered to a file by
let pict = make tree
renderToFile 75 150 "tree.png" tree
In both cases, first tree is converted to a picture here called pict, and then a canvas of width 75 and height 150 is created and pict is rendered on it.
Note that the size of the canvas is first specified at the point of rendering, and it is up to the programmer to ensure that the relevant graphics are placed on the canvas. Anything outside the canvas is ignored.
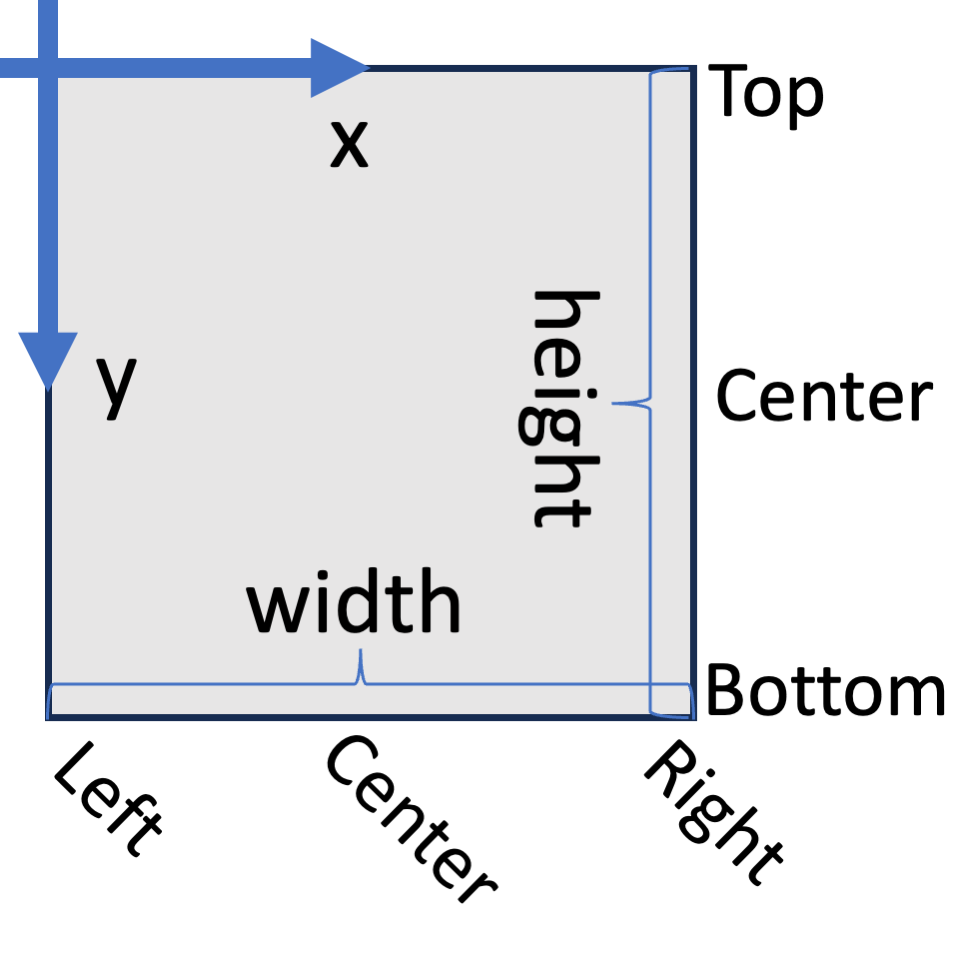
Canvas uses a row-column coordinate system, as illustrated in the figure to the right
 which implies that the origin is always rendered in the top left corner of an image and that the first coordinate, x, increases to the right, and the second coordinate, y, increases down. This is a natural coordinate system of images consisting of a table of pixels but may cause confusion when shown on the screen or in a file. For this reason,
 text produces images of sequences of letters to be read on the screen, which are intentionally represented upside down, i.e., with the top bar in the letter 'T' being closer to the origin than its foot such that they are shown right way up on the screen.
Each tree has a bounding box, and the bounding box is set differently for each element. For example, the bounding box of a piecewiseAffine curve is the smallest axis-aligned box, containing the points of the curve, and for a rectangle, it is the same as the rectangle. The bounding boxes are used by the onto, alignH, and alignV alignment commands. alignV takes two boxes and places the second below the first. It also takes one of Left, Center, or Right values as the alignment parameter, which further aligns the second with the left edge, center, or right edge of the first. alignH similarly aligns the second bounding box to the right of the first, and its alignment values Top, Center, and Bottom controls the vertical placement of the second box. Like the text function, the orientation is reversed such that Top gives an alignment closest to the origin and Bottom gives an alignment furthest from the origin, to fit the orientation used when rendered on the screen or to a file. The bounding boxes can be rendered for debugging by using the explain function instead of the make function.
The workhorse of Canvas is the interact function. To set up an interactive session, two functions must be defined: draw and react. The function react reacts to input from the user and possibly updates the model, and draw produces a picture for interact to render on the screen. The functions draw and react communicate through a state value defined by the programmer. The simplest example of this is an interactive session with no state and draw and react functions, which ignore their input, as shown below.
let tree = ellipse darkCyan 2.0 85.0 64.0 |> translate 128.0 128.0
let draw _ = make tree
let react _ _ = None
interact "Render an image" 256 256 None draw react 0
When executed, this program opens a window showing an ellipse centered on the screen.
The setup of draw, interact, and interact is essentially how the render function is implemented.
A more interesting example is shown below, where we define the state value to be a float, which will be used to communicate to draw where on the screen an ellipse is to be drawn. The react function is set to react on timer ticks and ignore anything else, and when a timer tick event occurs, it returns a new state value.
type state = float
let tree (i:state) : PrimitiveTree =
    ellipse darkCyan 2.0 85.0 64.0 |> translate i i
let draw (j: state) : Picture = make (tree j)
let react (j: state) (ev:Event) : state option =
    match ev with
        | Event.TimerTick -> Some ((j+1.0)%128.0)
        | _ -> None
let interval = Some 100
let initialState = 0.0
interact "Render an image" 256 256 interval draw react initialState
When executed, the window should show an ellipse being translated diagonally down from the top left corner to the bottom right. The speed will be as close to 0.1 seconds per step as possible.
The API is described in the file canvas.fsi. There you will find a precise declaration of all available values and functions and their documentation using the XML standard. The same documentation is also available at [https://diku-dk.github.io/diku-canvas/] (see API Reference in the left column of that page).
Several examples are available in the examples folder:
-
demonstrates how to make an animation
-
demonstrates how to save an animation as an animated gif
-
demonstrates all DIKU-Canvas graphics primitives, transformations, and combinators using arguments from the command line
-
demonstrates how to get and react to keyboard input
-
demonstrates how to render many lines using the onto combination
-
demonstrates how to make a small catch-the-monster game with the arrow keys
-
demonstrates how to get and react to mouse input
-
demonstrates how to render an image on the screen
-
an animation demonstration
-
demonstrates how to render a graphics tree to a file
-
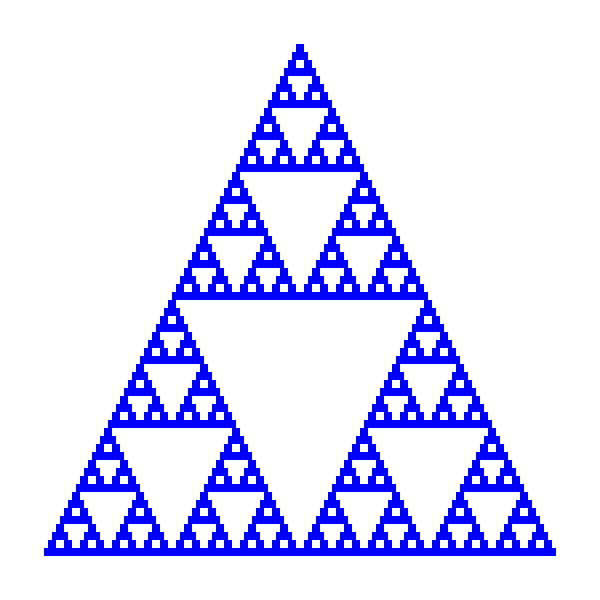
demonstrates how to recursively build a graphics tree
-
demonstrates how to recursively build a graphics tree
If you want to build the library and NuGet package yourself, you will
need the .NET7.0 SDK and the development version of SDL2 for your platform.
First, install .NET 7 for your platform.
Then install SDL2:
-
On macOS with homebrew:
brew install sdl2 -
On Debian and Ubuntu:
apt install libsdl2-dev -
On Arch (and probably Manjaro),
sdl2is available inextra:sudo pacman -S sdl2 -
On Windows you need
SDL2.dllin a search path available todotnet. The.dll's in thelib/folder should be sufficient for building. (Better instructions are a welcome contribution if anyone builds on Windows)
Finally, compile the library:
dotnet build
And pack it into a NuGet package:
dotnet pack
The package will be available in bin/Debug/Canvas.X.y.z.nupkg.
Start by creating a directory to use as a local NuGet repository. Add
it to the NuGet sources list:
dotnet nuget add source /full/path/to/the/directory
Ensure the repository was added with:
dotnet nuget list source
Place Canvas.X.y.z.nupkg in the local repository.
Now clear the nuget cache:
dotnet nuget locals all -c
Test that everything worked with dotnet fsi
dotnet fsi
>#r "nuget:DIKU.Canvas";;
>open Canvas;;
Canvas is now available to use in projects through NuGet, both in the
interpreter and in projects with e.g. .fsproj files.
MIT license
Copyright 2018-2021: Martin Elsman
Copyright 2022-2023: Ken Friis Larsen
Copyright 2023- : Ken Friis Larsen and Jon Sporring
The following individuals have contributed to the DIKU.Canvas (previously ImgUtil) library:
- Ken Friis Larsen
- Martin Elsman
- Mads Dyrvig Obitsø Thomsen
- Jon Sporring
- Jan Rolandsen
- Chris Pritchard (original SDL P/Invoke)


