-
Open the Stream or not page. You can add your own video to test, or use the default video (of a NASA rocket launch).
-
There are a lot of parameters you can play with to affect how the video appears and how it plays back. To start just submit the default parameters.
-
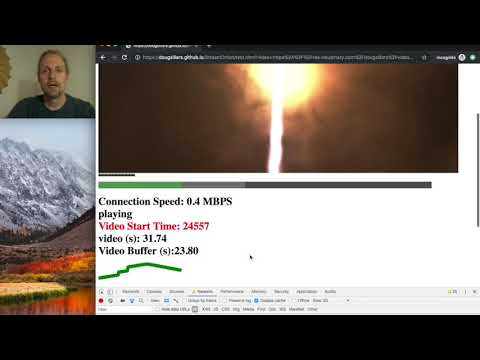
As the video starts to play, you'll notice a number of Stats accumulating below the video on playback.
-
When the video completes, a summary is presented
-
Test the video at different network speeds using devTools or a proxy like Charles.
-
Now go back, and try it with your videos to see how well they play back.
- Add 'video' query parameter to the url pointing to your video to get stats on how well your video plays back
- Videos rarely load alone on the web, and there are other assets competing for bandwidth.
- Add 'imagecount' query parameter. Values can be from 0 to 99. This will download the specified number of images while the video is playing back.
- You can see the images load right below the video, and again below all the text as 10x10 images.
- You can choose to deliver the images via HTTP or HTTP2 (http2 parameter). Why do we care?
- Images delivered by HTTP2 will use just one HTTP connection.
- Using HTTP1 (http2=false) better simulates many connections for files from many domains. It will max out the number of browser connections (if you use enough images.)
- Oh, and JavaScript parsing will be going on - slowing down the browser, CPU, etc.
- Add js=true query parameter. This will compute a recursive fibonacci every 250ms during playback to simulate JS execution.
- You can see the parse times in the console.
- The bar at the top shows how far the playback has gone (green), and the amount of video in the buffer (gray). Code borrowed from MDN
- On Chrome, the connection speed is shown (navigation.connection is Chrome only)
- Video playback state. Possible options are
- Not Started
- Playing
- waiting
- stalled
- empty buffer
- ended
- Video Start time. Measured from start of JS execution to when the video begins playing. The longer this takes, the text color changes to yellow and then red.
- Playback time (in seconds)
- Remaining time in buffer (in seconds)
This chart shows the amount of video in the downloaded buffer (video that is local and ready to play.) In the above chart, there is an initial big jump in data in the buffer, and small subsequent jumps that 'top off' the buffer as it slowly empties.
The more video that is in the buffer, the less likely there will be a stall. In the chart, if there is more than 10s of video in the buffer, the line is green. If there is between 5-10s in the buffer, the line is yellow (low). If there is less than 5s in the buffer, the line is red (danger).
Where did I come up with these metrics for danger and low? I made a good educated guess.
When the buffer level is really low, there is a possibility that it will empty, and the video will stall. The most recent stall length is displayed, as is the total count of stalls (and the total elapsed time)
If you (like me) love using WebPageTest to get metrics on page load, StreamOrNot can report the streaming data via custom metrics. Once the video is completed, the video results are placed in hidden DIVs that WPT can read.
To import the video results data into WPT, copy the following into the Advanced Settings:Custom:Custom Metrics:
[videostats]
return document.getElementById("WPTData").innerHTML;
[videoStartTime]
return document.getElementById("WPTStartTime").innerHTML;
[videoStallTotal]
return document.getElementById("WPTStallTotal").innerHTML;
[videoStallTotalTime]
return document.getElementById("WPTStallTotalTime").innerHTML;
[videominStall]
return document.getElementById("WPTminStall").innerHTML;
[videomaxStall]
return document.getElementById("WPTmaxStall").innerHTML;
[videoavgStall]
return document.getElementById("WPTavgStall").innerHTML;
[videoBufferPercentDanger]
return document.getElementById("WPTBufferPercentDanger").innerHTML;
[videoBufferPercentLow]
return document.getElementById("WPTBufferPercentLow").innerHTML;
[videoBufferPercentSafe]
return document.getElementById("WPTBufferPercentSafe").innerHTML;
[videoBufferMax]
return document.getElementById("WPTBufferMax").innerHTML;
[videoBufferStart]
return document.getElementById("WPTBufferAtStart").innerHTML;
[videoBitrateChangeCount]
return document.getElementById("WPTBitrateChangeCount").innerHTML;
[videoDuration]
return document.getElementById("WPTVideoDuration").innerHTML;
[videoWidth]
return document.getElementById("WPTVideoWidth").innerHTML;
[videoHeight]
return document.getElementById("WPTVideoHeight").innerHTML;
[videoAspectRatio]
return document.getElementById("WPTVideoAspectRatio").innerHTML;
[videoBitrate]
return document.getElementById("WPTVideoBR").innerHTML;
[videosizeKB]
return document.getElementById("WPTSizeKB").innerHTML;
[videoVideoDisp]
return document.getElementById("WPTVideoDisp").innerHTML;
[videoAudioDisp]
return document.getElementById("WPTAudioDisp").innerHTML;
[videoStreamCount]
return document.getElementById("WPTStreamCount").innerHTML;
[videoStreamType]
return document.getElementById("WPTStreamType").innerHTML;
[videocodec]
return document.getElementById("WPTVideoCodec").innerHTML;
The first entry is a JSON object with all of the stats. However, when testing with WPT - one typically runs multiple tests and collect the median value. What's the median value of a JSON object? So, for (mostly my) convenience, each piece of data is also supplied as an individual stat.
I have modified Andy Davies' WPT Bulk Tester to include the video stats.
You can copy my video enhanced version, and use it for your tests.
**NB: I have set the median metric to be the video startup time. Typically WPT uses the SpeedIndex as the median. **


