-
Notifications
You must be signed in to change notification settings - Fork 139
JDT Debug View update mechanism
The Debug View (aka Launch View) displays information while debugging applications written in different languages. Development tools for a language plug into the Debug View framework, and provide information specific to that language. In the following we examine how JDT uses this framework to display the state of the debuggee JVM.
Most notably, JDT uses the Debug View to display JVM threads while debugging. This includes running/suspended state as well as stack traces for suspended threads. The information is retrieved over JDI, the Java Debug Interface. Model deltas are then passed to the Debug View in order to display the state.
Communication with the debuggee JVM is done mainly over the following classes:
org.eclipse.jdt.internal.debug.core.model.JDIDebugTargetorg.eclipse.jdt.internal.debug.core.EventDispatcherorg.eclipse.jdt.internal.debug.core.IJDIEventListenercom.sun.jdi.request.EventRequestcom.sun.jdi.ThreadReference
JDIDebugTarget registers implementers of IJDIEventListener, where each
listener is paired with a specific EventRequest. Every event request is
served by the debuggee JVM by adding an event to the JVM event queue.
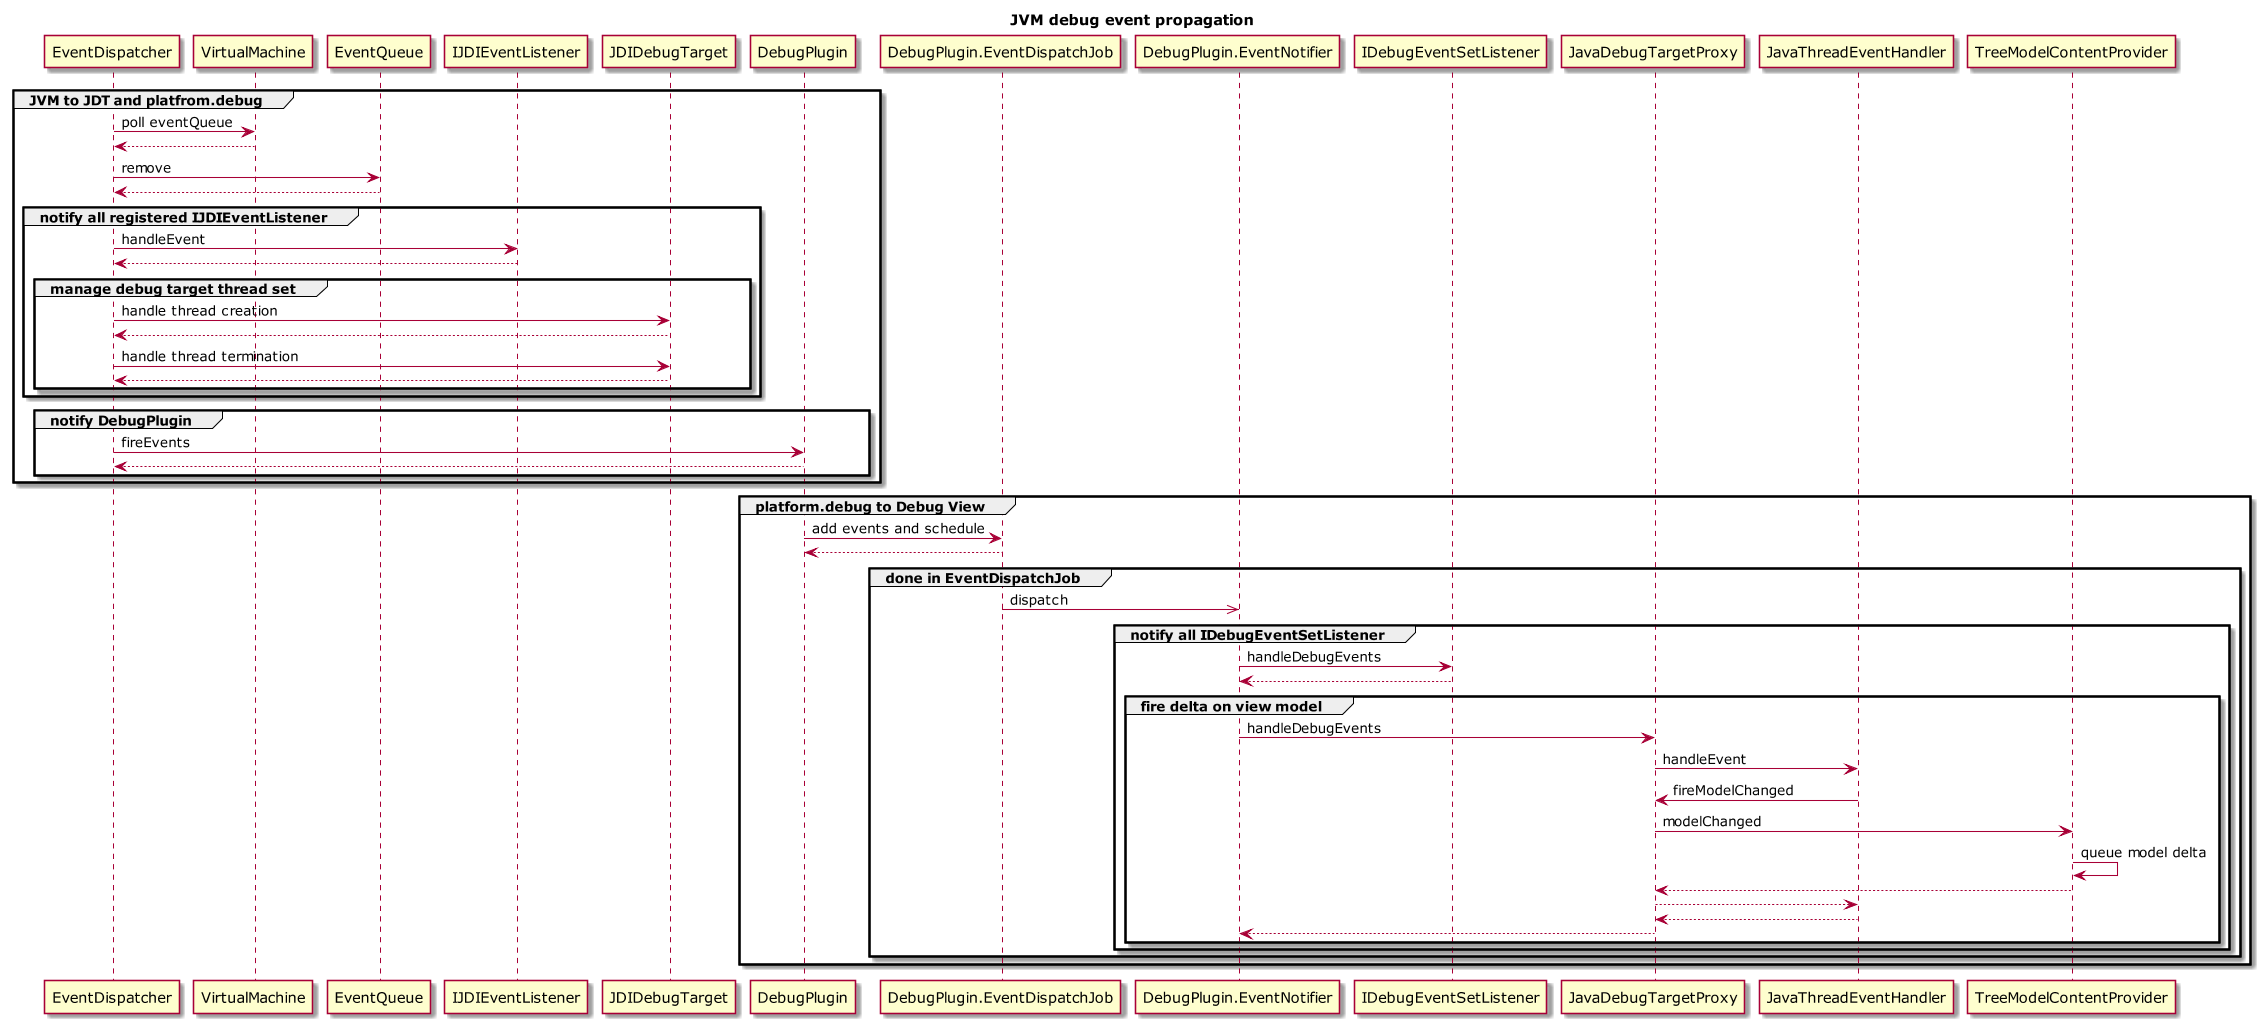
EventDispatcher runs in a daemon thread (started by JDIDebugTarget) and
polls the event queue, notifying listeners when their respective event
is retrieved from the queue. Polling continues until the JVM disconnects
or terminates, which is signaled by the JVM with a respective event.
The information displayed by the Debug View is, from top to bottom:
- debug target
- threads
- stack frames of suspended threads
Of these, threads and stack frames are retrieved from the debuggee JVM.
To retrieve active threads from the JVM, JDIDebugTarget registers JDI
event listeners for thread start and death events. These listeners then
maintain the set of threads in JDIDebugTarget; the set itself is used to
back the Debug View model. The stack frames of a thread are retrieved
over the JDI interface ThreadReference, whenever the thread is
suspended. The suspended state is detected with a JDI EventRequest and a
JDT IJDIEventListener.
Note that JDI event listeners are mostly notified in the EventDispatcher daemon thread. The exception here is conditional breakpoint hit events.
To propagate the JVM state to the Debug View, mostly the following classes are used:
org.eclipse.debug.core.DebugPluginorg.eclipse.debug.core.DebugPlugin.EventDispatchJoborg.eclipse.debug.core.IDebugEventSetListenerorg.eclipse.debug.core.DebugEventorg.eclipse.debug.internal.ui.viewers.update.EventHandlerModelProxyorg.eclipse.jdt.internal.debug.ui.threadgroups.JavaThreadEventHandlerorg.eclipse.debug.internal.ui.viewers.model.TreeModelContentProviderorg.eclipse.debug.internal.ui.viewers.model.provisional.IElementContentProviderorg.eclipse.debug.internal.ui.viewers.model.provisional.IViewerUpdate
Two paths exist, which change the Debug View contents based on JVM state:
- JDI event handling over DebugPlugin events of type
DebugEvent. - Implementers of
IElementContentProviderquery the JVM state directly fromJDIDebugTargetandJDIThread.
The first path is realized as follows. Once thread start, suspend or
termination events are retrieved from the JVM event queue,
EventDispatcher enqueues events of type DebugEvent and EventDispatchJob
is scheduled. The job will then notify registered implementers of
IDebugEventSetListener (registered with
DebugPlugin.addDebugEventListener) of the enqueued events. One of these
listeners is JavaThreadEventHandler; this listener will create model
deltas for TreeModelContentProvider.
The second path is triggered either by processing of model deltas or by user interactions with the Debug View tree. User interactions include e.g. collapsing or expanding elements and scrolling.
Model deltas consist of an index based path to a specific element, plus flags which indicate the change in the element. E.g. a suspended thread delta has the following form:
 Element: org.eclipse.debug.internal.core.LaunchManager@5b5a89d1
     Flags: NO_CHANGE
     Index: -1 Child Count: -1
   Element: org.eclipse.debug.core.Launch@40188d00`
       Flags: NO_CHANGE
       Index: 0 Child Count: 2
     Element: org.eclipse.jdt.internal.debug.core.model.JDIDebugTarget@2c1bdb44
         Flags: NO_CHANGE
         Index: 0 Child Count: 4
       Element: java.lang.Thread (name=main, id=1)
           Flags: CONTENT | EXPAND | REVEAL |
           Index: 3 Child Count: 1`
         Element: org.eclipse.jdt.internal.debug.core.model.JDIStackFrame@16ed4d37
             Flags: SELECT | STATE |
             Index: 0 Child Count: 0
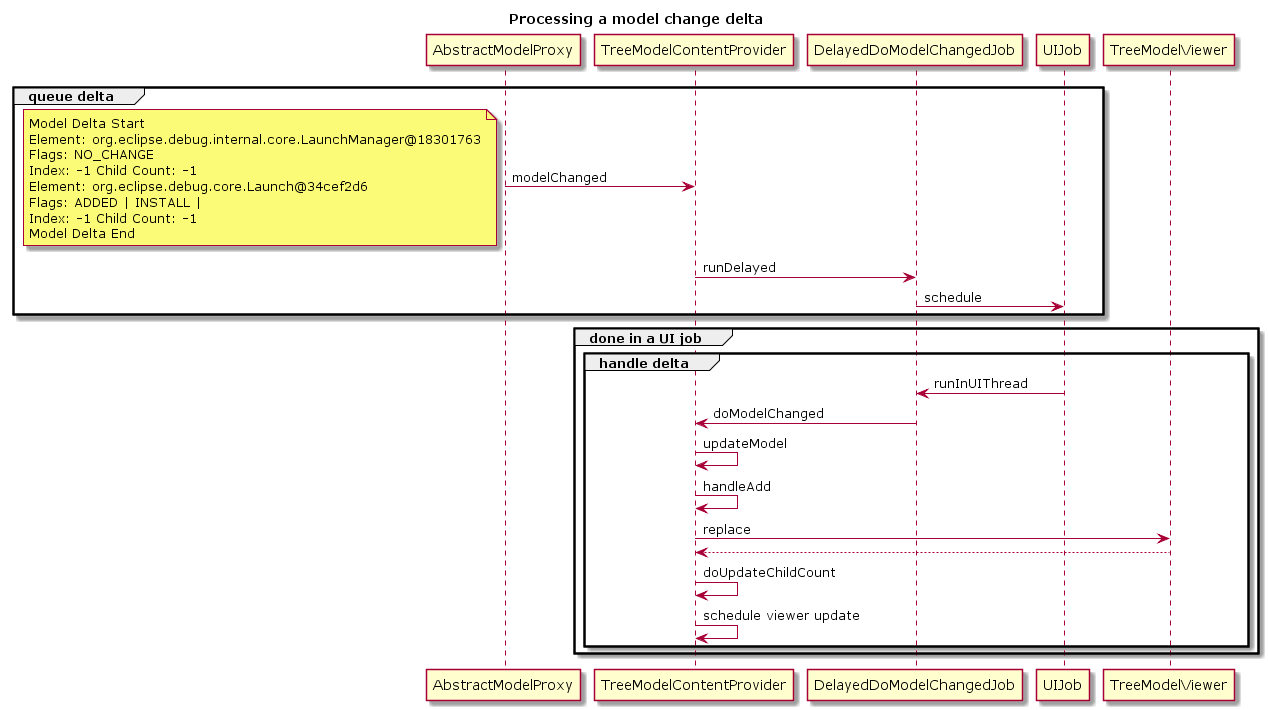
The deltas are computed by JavaThreadEventHandler during a DebugEvent
notification in DebugPlugin.EventDispatchJob. The deltas are enqueued in
TreeModelContentProvider and a UI job is scheduled to eventually process
the deltas. Processing the deltas introduces changes in the Debug View
tree, such as adding or removing threads, or expanding suspended threads
to show stack frames. These changes in turn schedule viewer updates.
Note that the Debug View tree is lazy. If a thread is created in the JVM, and this thread cannot be displayed due to limited view area, the respective model delta will not result in an actual change in the tree. The thread will be displayed only later on, when e.g. scrolling results in a viewer update. Note that hitting a breakpoint in a thread which is not visible will result in automatic scrolling, so that the stack frame at which the JVM is suspended is shown.
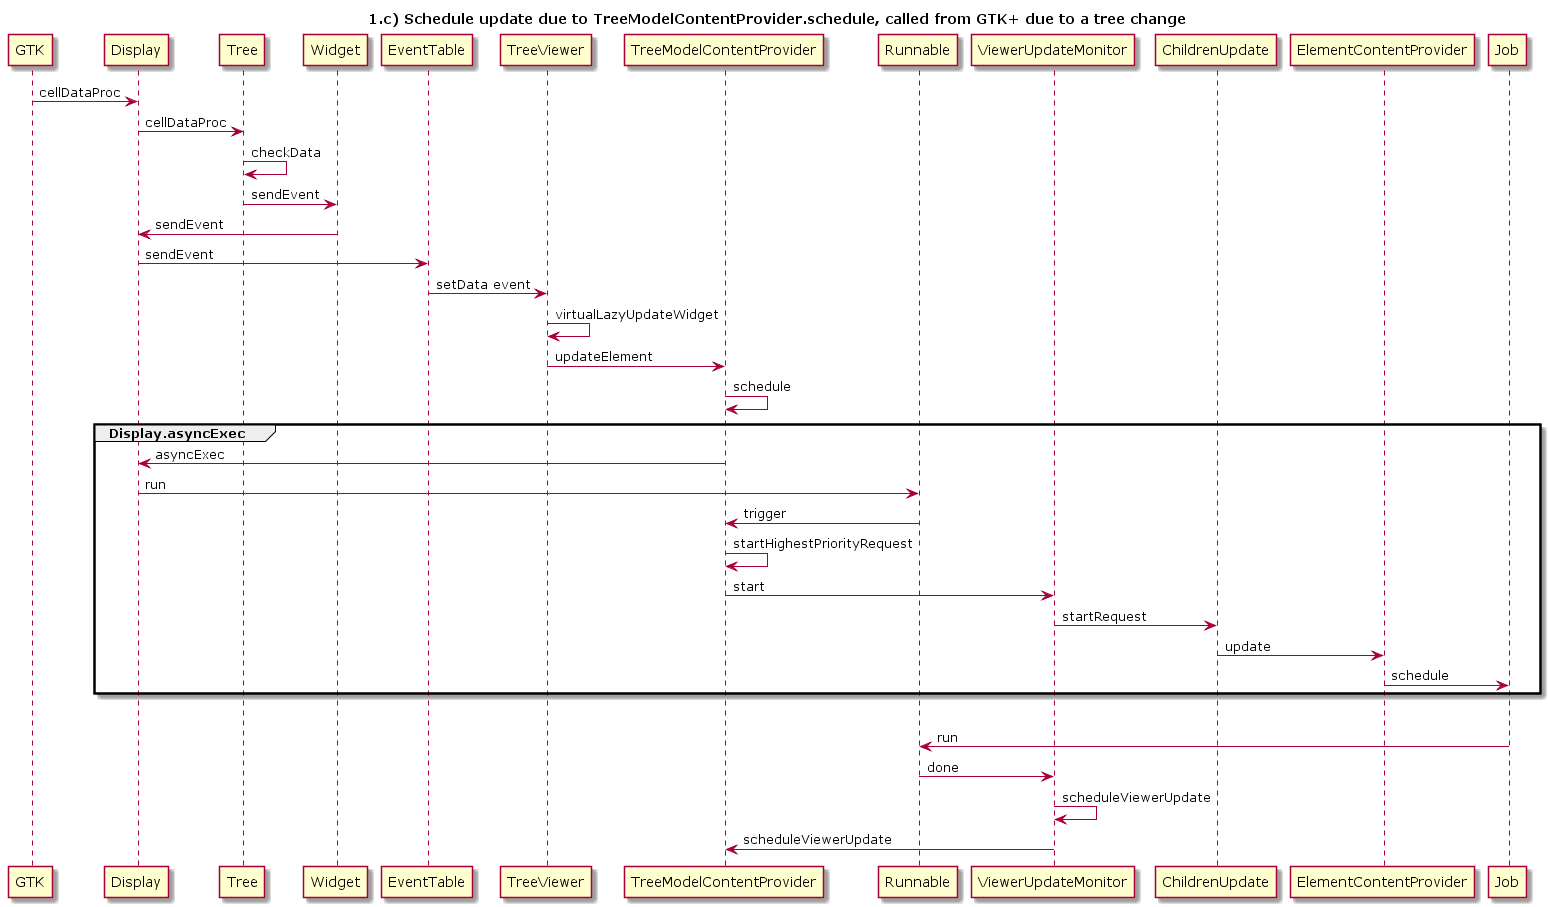
The main purpose of viewer updates is to keep the Debug View tree contents up-to-date when no model deltas do so. An example of this is collapsing and then expanding a suspended thread. Since there are no suspend events from the JVM during this tree interaction, the model delta mechanism cannot ensure that stack frames are shown after the expand. Instead, a viewer update is done; the update will query the stack frames of the thread and display them.
The viewer update occurs in two operations. First,
org.eclipse.debug.internal.ui.model.elements.ElementContentProvider will
query JVM elements from a job. Then, a UI job is scheduled to set those
elements in the Debug View tree. This ensures that operations done in
the UI thread cannot block due to retrieving elements from a debugger,
such as retrieving stack traces from the debuggee JVM.
There are three types of viewer updates:
org.eclipse.debug.internal.ui.viewers.model.ChildrenCountUpdateorg.eclipse.debug.internal.ui.viewers.model.ChildrenUpdateorg.eclipse.debug.internal.ui.viewers.model.HasChildrenUpdate
A viewer update can trigger further viewer updates, e.g. a
ChildrenCountUpdate on the debug target will result in a ChildrenUpdate
for that debug target. The ChildrenUpdate on the debug target can result
in threads being added to the tree (e.g. due to scrolling and revealing
threads which weren't visible before), in turn triggering a
HasChildrenUpdate for each added thread.
TreeModelContentProvider will also try to accumulate viewer updates into
one update, whenever a viewer update is scheduled. The following rules
apply for the accumulation:
-
ChildrenUpdatecan accumulate anotherChildrenUpdate, if the two updates have an overlapping range. The union of the two ranges is the range of the resulting update. -
ChildrenCountUpdatecan always accumulate anotherChildrenCountUpdate, the other update is added to a set of batch updates. The entire batch is run when the resulting update is run. -
HasChildrenUpdatecan always accumulate anotherHasChildrenUpdate, the other update is added to a set of batch updates. The entire batch is run when the resulting update is run.
This reduces the number of UI jobs necessary to update the view, to some extent.


