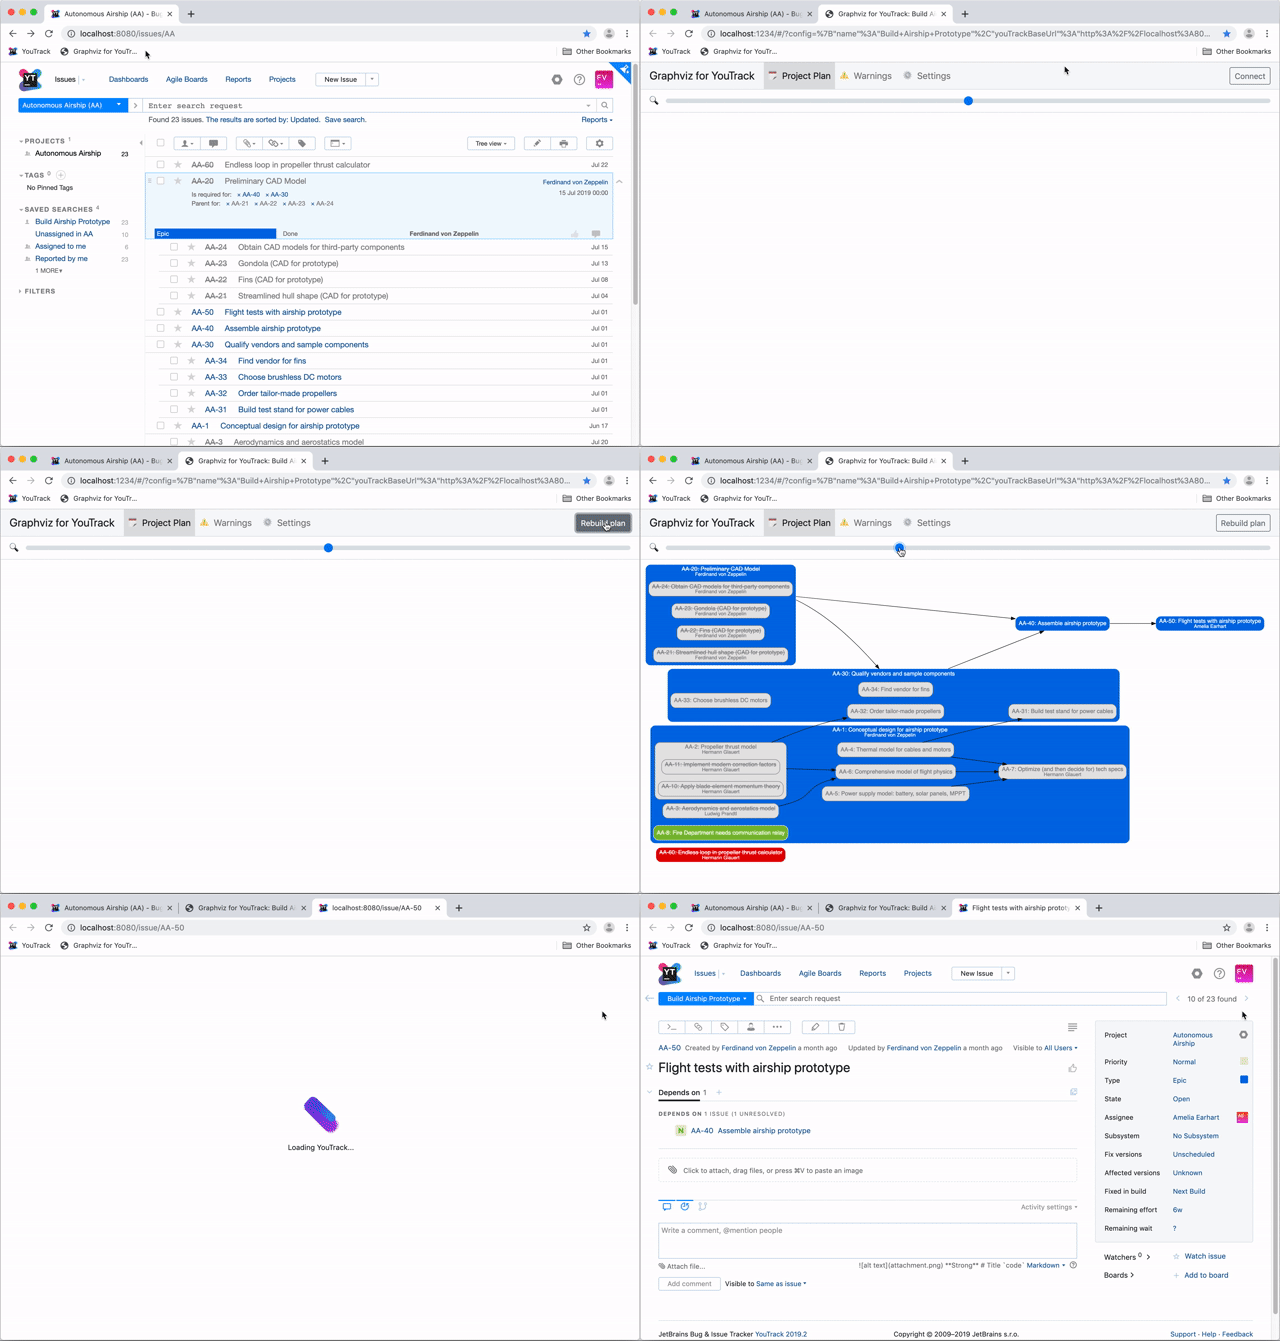
Graphviz for YouTrack. Web app that builds a visual overview of the issues in a YouTrack saved search.
- Web app that visualizes both parent-child and dependency relationships of the issues in a YouTrack saved search.
- Solves a popular feature request for YouTrack (see YouTrack issue JT-13900).
- Runs entirely in the browser. No installation required by users. (As a one-time setup, the YouTrack administrator needs to add the URI of the web app to the so-called “Resource Sharing” settings in YouTrack.)
- No separate login required for this web app (assuming the user is already logged into YouTrack).
- Available for immediate use at: https://fschopp.github.io/graphviz-for-you-track
- This web app never comes in touch with your password (thanks to OAuth 2.0).
- For maximum peace of mind, it is always possible to fork this repository and/or host this web app yourself.
- Based on:
- fschopp/project-planning-ui-for-you-track for the user-interface framework and for configuring the connection to YouTrack.
- fschopp/project-planning-for-you-track for the communication with YouTrack.
- adamhaile/S.js and adamhaile/Surplus for reactive programming of the user interface.
- mdaines/viz.js for running Graphviz in a browser.
- Graphviz for the graph visualization.
- Written in TypeScript.
- Partial source code documentation available. Generated by TypeDoc.
- Test coverage is currently incomplete. However, the underlying package fschopp/project-planning-for-you-track has complete test coverage.
- See the corresponding section in project fschopp/project-planning-ui-for-you-track. The description there applies for this project as well.

