Baboon is a project about code coverage. For recording and displaying the
line-by-line coverage of CLR programs running with mono and and also now
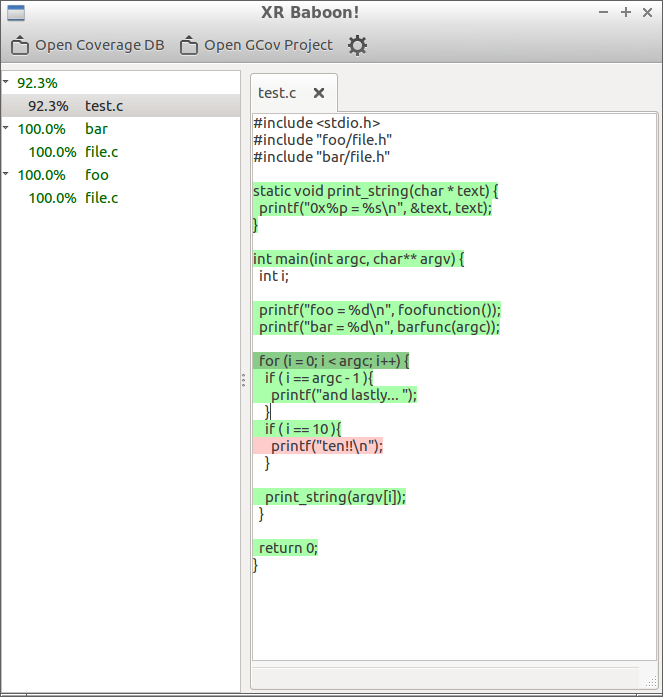
displaying coverage data for C/C++ applications built by gcc with -fcoverage
Baboon contains three tools: covem and cov-gtk and cov-html
cov-gtk and cov-html are reporting tools that understand the data recorded
by covem and by gcov
covem is a simple code coverage tool originally for mono. It will record
which lines of your source are actually executed and log some basic statistics
like call counts and the number of times a line is actually run.
It is built on top of Mono.Debugger.Soft and so requires the mono runtime rather than the .Net one.
Results are gathered by the covtool program and can be displayed/analysed by the cov-console or cov-gtk programs.
Coverage data generated by covtool ( via Mono.XR.Cover library ) is saved in a Sqlite database file for easy processing and quick generation.
covtool will run any mono/c# process you ask of it, such as nunit-console or even graphical apps. In time covtool may allow you to attach to existing processes after they have started.
XR.Mono.Cover will not check coverage of unmanaged code, perhaps one day if Mono.Debugger.Soft does, this will too.
I'm only aiming at linux but this should work well on OSX and Windows ( if you install mono ).
Like all good analysis tools, Baboon can test itself! See here for some results.
Baboon also includes a binary of nunit.framework.dll for it's tests.
Building baboon is fairly easy, you can use mdtool to build the solution file or load it in monodevelop.
If you wish to make the bundled binary (not necessary but easier to deploy) do:
$ bash make_bundle.sh
Which should give you the 'covem' program (on linux anyway)
You can use the included Makefile to install baboon under Linux.
Use make install to install without using make_bundle.sh (see above).
Use make installbundle for installing the bundled version.
Be sure to deploy the libsqlite3.so.0 (or sqlite3.dll on Windows) C
library wherever you run your app. If it is the same machine as the build was
done on you neede't worry. Your 'test' program/assembly needs to have been
built with debugging enabled (you need the mdb files) else baboon won't know
how to inspect the running code.
First, we need to create a coverage config file to tell covem what
classes/types you want to record coverage data for. If you have a called called
'XR.HttpFileStream' and if your program is called 'myserver.exe' then create
a text file called 'myserver.exe.covcfg' and add a line to it that contains a
regex to match your type name like so:
^XR.HttpFileStream
Save it, and then run your program as usual but put 'covem' (or the full path to the covem program or exe) atthe start of the line. Eg,
$ /home/inb/tmp/covem myserver.exe --port 19000 --verbose
And baboon will start the program and start recording coverage data.
If you are only interested in line coverage without hit counts you can add the following line to the config file. This will increase performance significantly.
$HitCount=false
The covering process may be interrupted by sending baboon SIGINT. The results
will still be saved. Another way to interrupt the covering process is to specify
$TerminatorMethod in the config file and invoke the method on the covered
process:
$TerminatorMethod=Namespace.TypeName.MethodName
baboon can be attached to an existent process as Mono Soft-Mode Debugger. Eg,
$ /home/inb/tmp/covem -a myserver.exe 127.0.0.1 19000
where 127.0.0.1 is the address and 19000 is the port number.
If the process has a waiting thread, the thread may invoke a method when baboon is ready by adding the following lines to the config file:
$InvokeMethod=Namespace.TypeName.MethodName
$InvokeThread=ThreadName
The method may trigger an execution of the code you are interested in.
Looking at results is fairly easy. Once your program has ended ( or after every
2 minutes, or after sending it SIGUSR2 ) you will find a new file called
'myserver.exe.covdb'. Launch the cov-gtk app and load this file using the
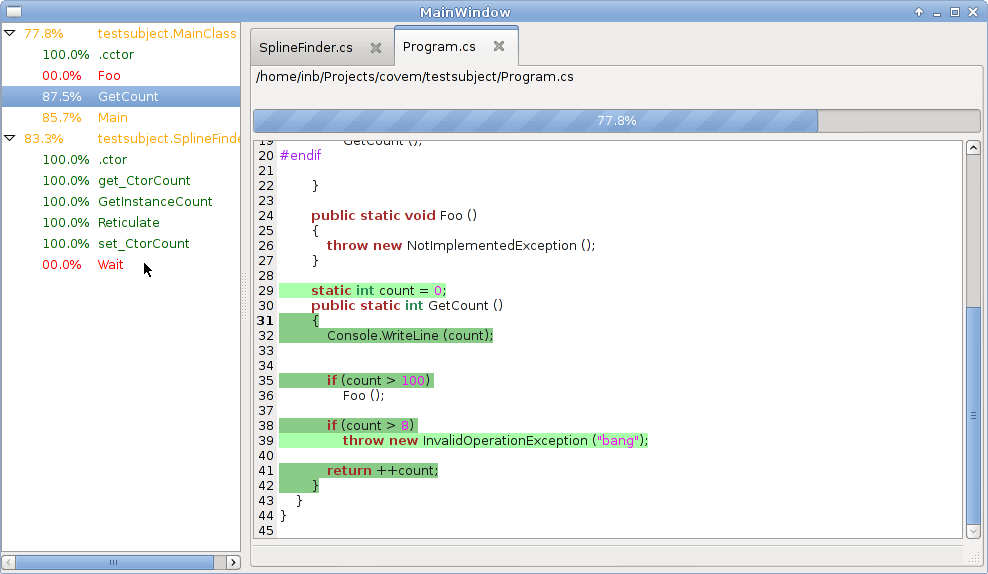
open button and you'll see coverage data as above.
cov-html generates an HTML summary report of coverage per class and method.
Usage: covtool/bin/cov-html.exe COVDB_FILE REPORT_TITLE Report is
written to html/index.html.
cov-srchtml generates HTML pages with source code coloured and annotated by
coverage status, with
a tree view for navigation.
Usage:
cov-srchtml COVDB_FILE SRC_PATH OUTPUT_PATH

cov-srchtml --gcov SRC_PATH OUTPUT_PATH
Open OUTPUT_PATH/index.html.
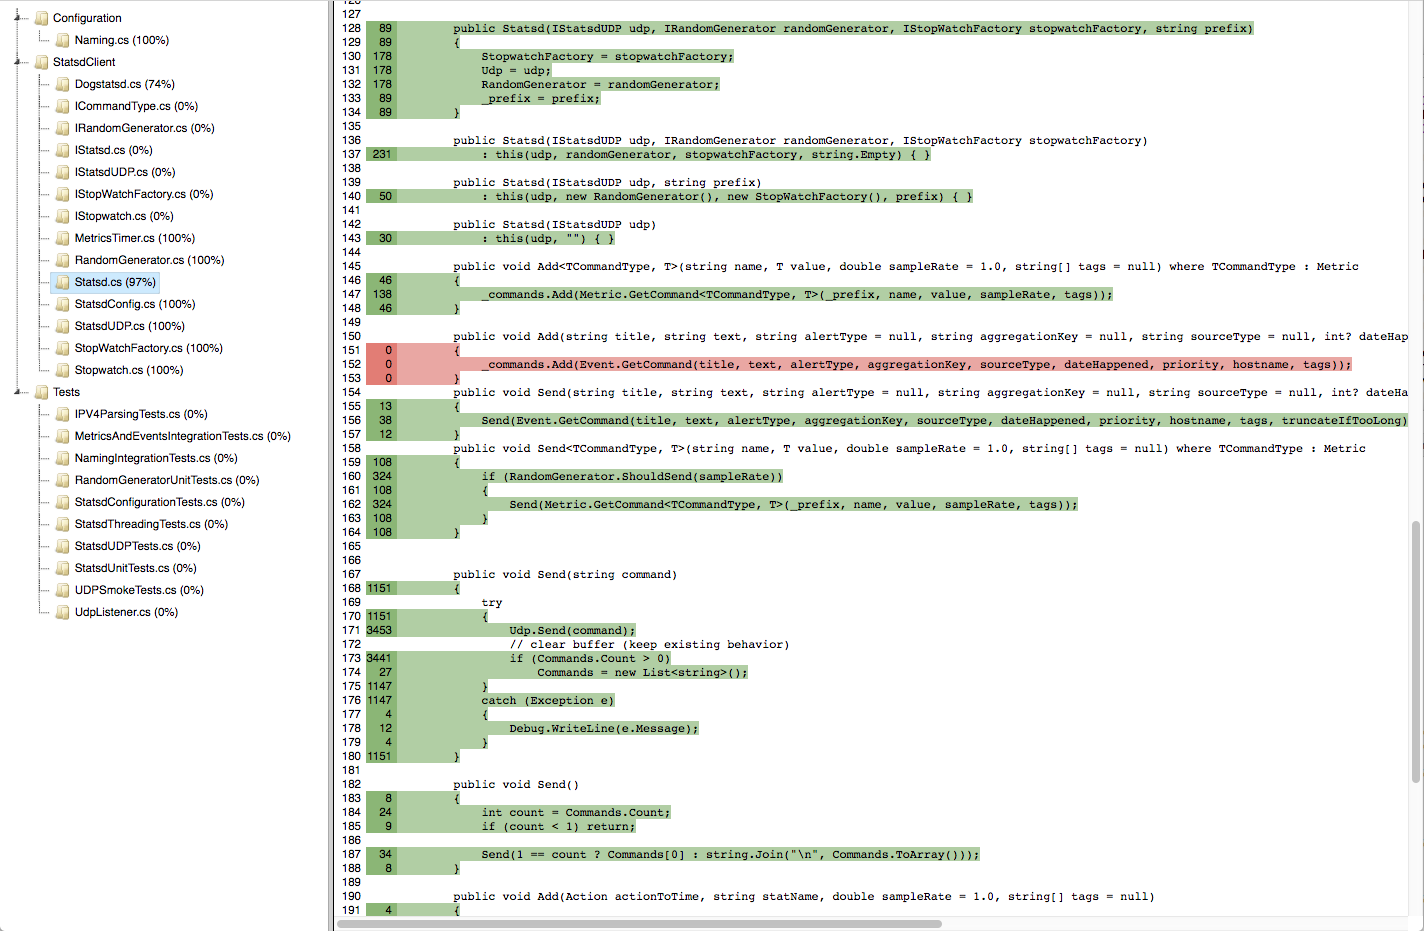
This is a screenshot of cov-srchtml's output showing test coverage for a version of dogstatsd-csharp-client:


