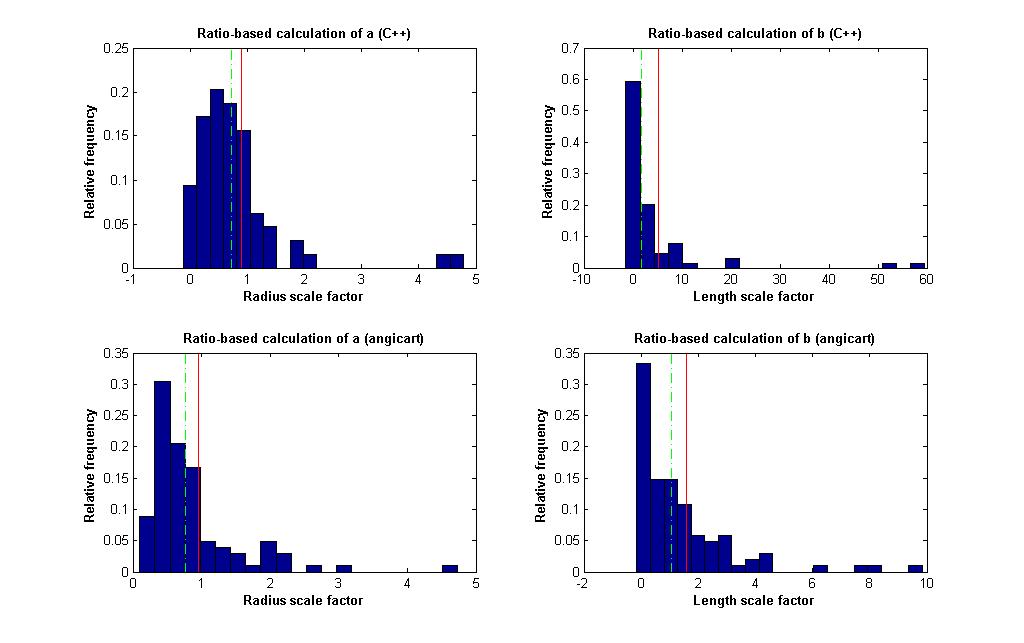
This repository uses methods described in the following paper: http://journals.plos.org/ploscompbiol/article?id=10.1371/journal.pcbi.1004455
The paper details four methods used to calculating scaling exponents of vascular networks:
- A conservation based method
- A ratio based method
- A regression based method
- A distribution based method
This repository contains MATLAB code to generate plots to compare data outputted by two versions of vessel extraction software: Angicart (written in OCAML) and Angicart++ (written in C++)
The datasets used in this repository are for academic research purposes and can be found here: https://drive.google.com/drive/folders/1o7fbUU70ivLRVF-NcohQUgnZu-PkPM9U?usp=sharing
- files labeled with a _c extension are outputs of the C++ data (ie. patient1_c.txt)
Notes: The directory with data files must be added to your project path. Make sure the MATLAB Statistics and Machine Learning toolbox is installed
- Run calcAll.m to generate all plots for a single dataset (change cName for the filename of the C++ data and aName for the filename of the Angicart data)
- compareLen.m and compareRad.m generate histograms to compare the lengths of vessels and the radii of vessels
- ratioBased.m, conservationBased.m, regressionBased.m, and distributionBased.m generate plots using each of the methods for both length and radii of a given dataset
- Helper functions: importOption.m, fillArr.m, getBinFreq.m, calcA.m
If you would like to contribute to this project, visit https://vsavage.faculty.biomath.ucla.edu/Code/HTML/indexangicplusplus.html
