This is the source code for a test application built for the purpose of my master's dissertation. This is one out of 3 different versions of the same application built for research purposes. This one features a microservices-based architecture and a message-driven approach, other is also microservices-based but with a direct synchronous inter-service communication (link), and the last one follows a monolithic approach (link).
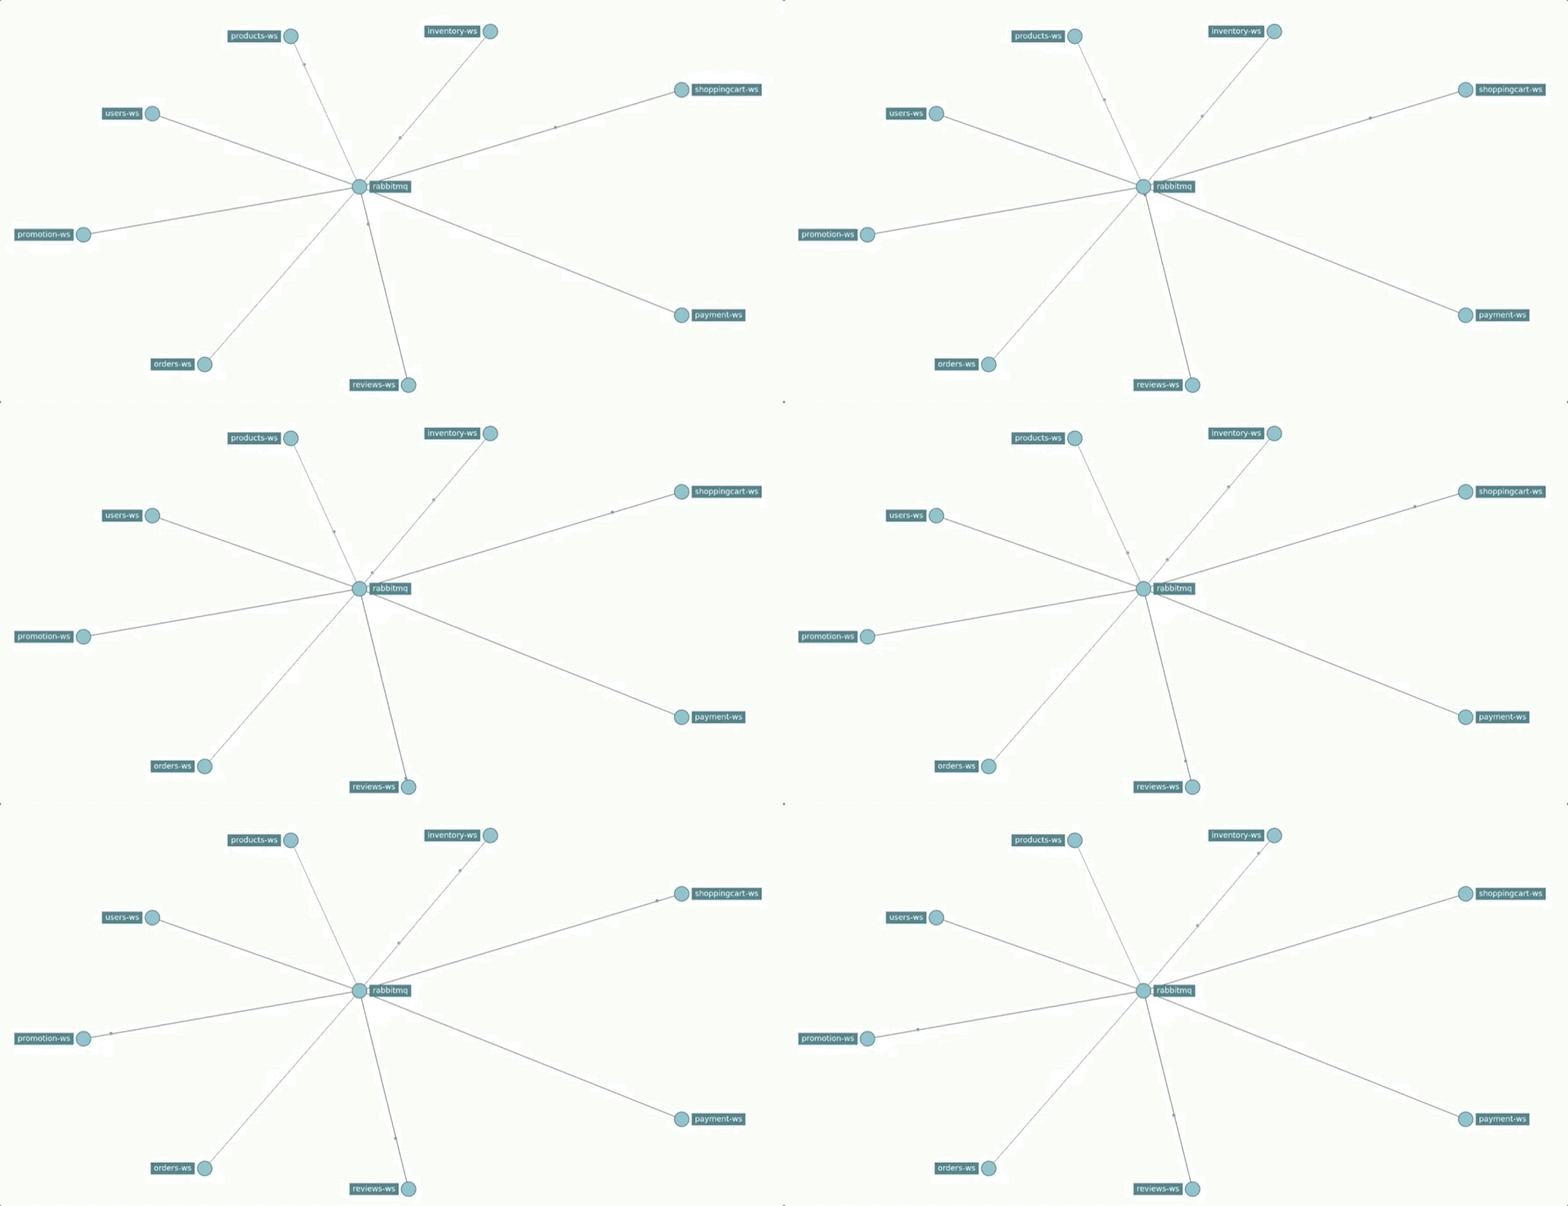
Several typical microservices patterns, such as CQRS, database-per-service, Saga Transactions, and more were implemented. This version features a message-driven approach, using RabbitMQ as the message broker, making the services completely unaware of each other, promoting fault isolation and loose coupling.
A Docker Swarm cluster is used and it is composed of 4 stacks:
- Main application stack, composed of:
- Inventory Serivce
- Order Service
- Payment Service
- Product Service
- Payment Service
- Promotion Service
- Review Service
- Shopping-cart Service
- User Service
- Catalog View
- Orders/Users View
- API Gateway
- RabbitMQ
- MySQL database
- MongoDB database
The main business services were built using Java and Spring Boot version 2.4.4.
-
Monitoring stack
- Grafana
- cAdvisor
- Prometheus
- Node exporter
-
Logging & Tracing stack
- Elastic Search
- Logstash
- Kibana
- Zipkin
To further promote high-availability, GlusterFS was installed on each one of the nodes, which synchronizes the state of specific services, in this case, both the MySQL and MongoDB databases. This enables the possibility of starting the databases service in any of the cluster nodes while keeping the state synchronized.
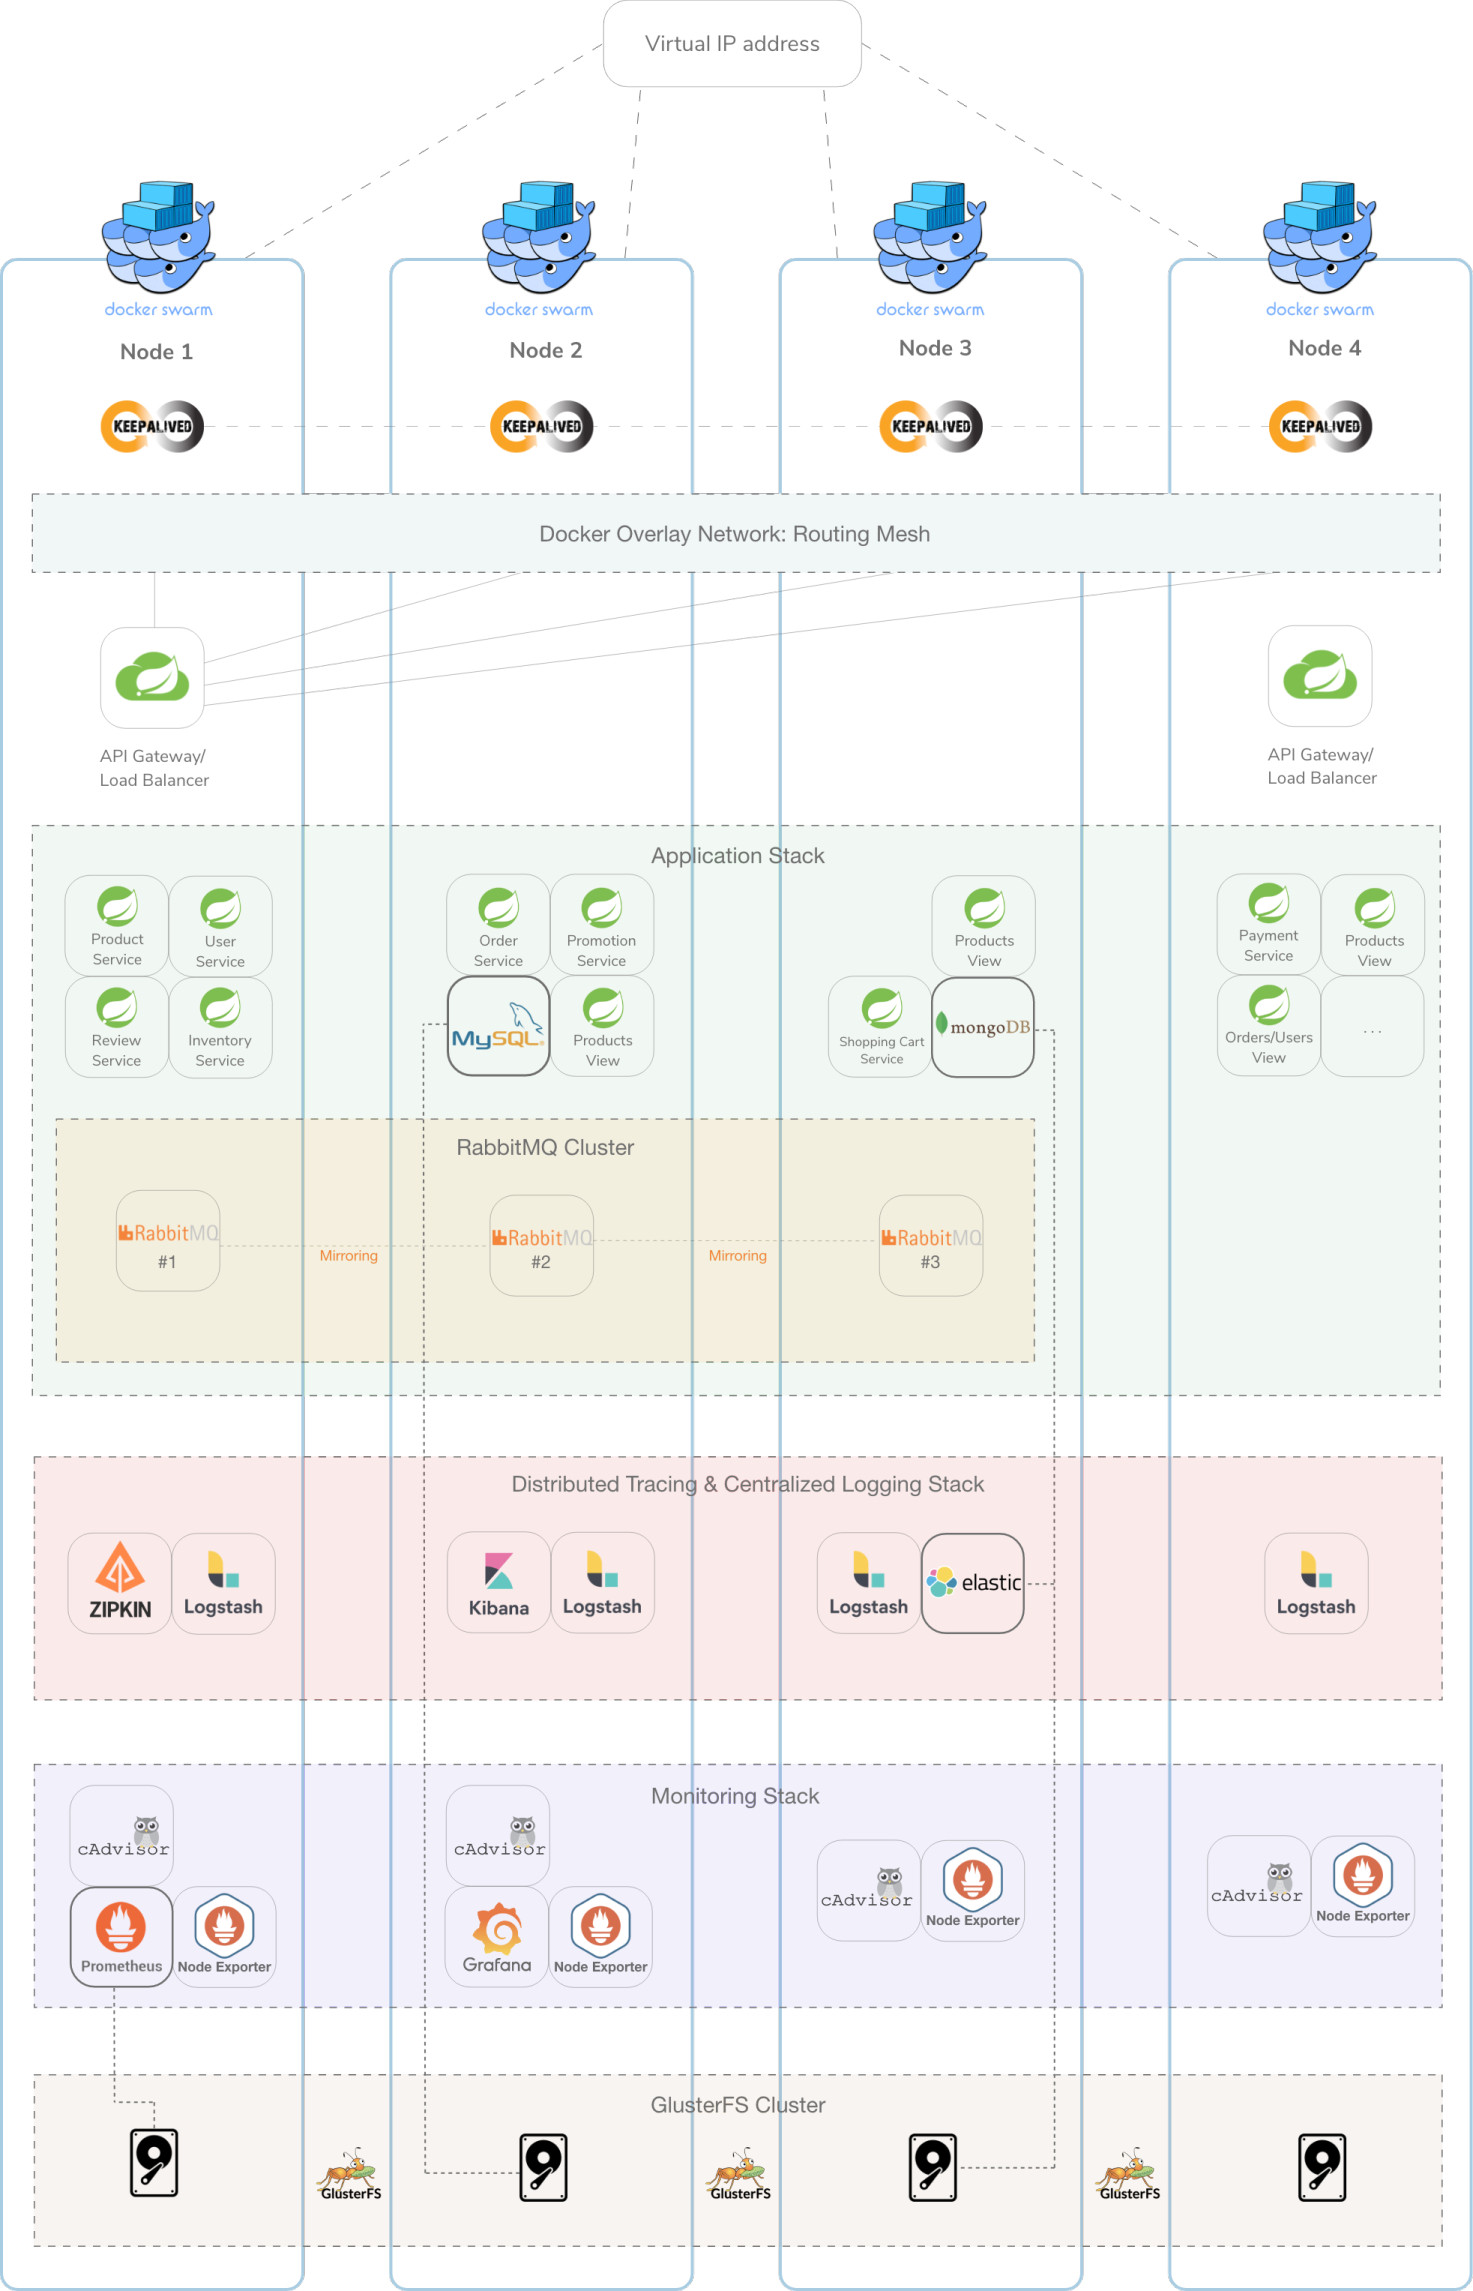
The following image represents an overview of the architecture. Each node is represented as a vertical rectangle and the Docker Swarm stacks as horizontal rectangles.
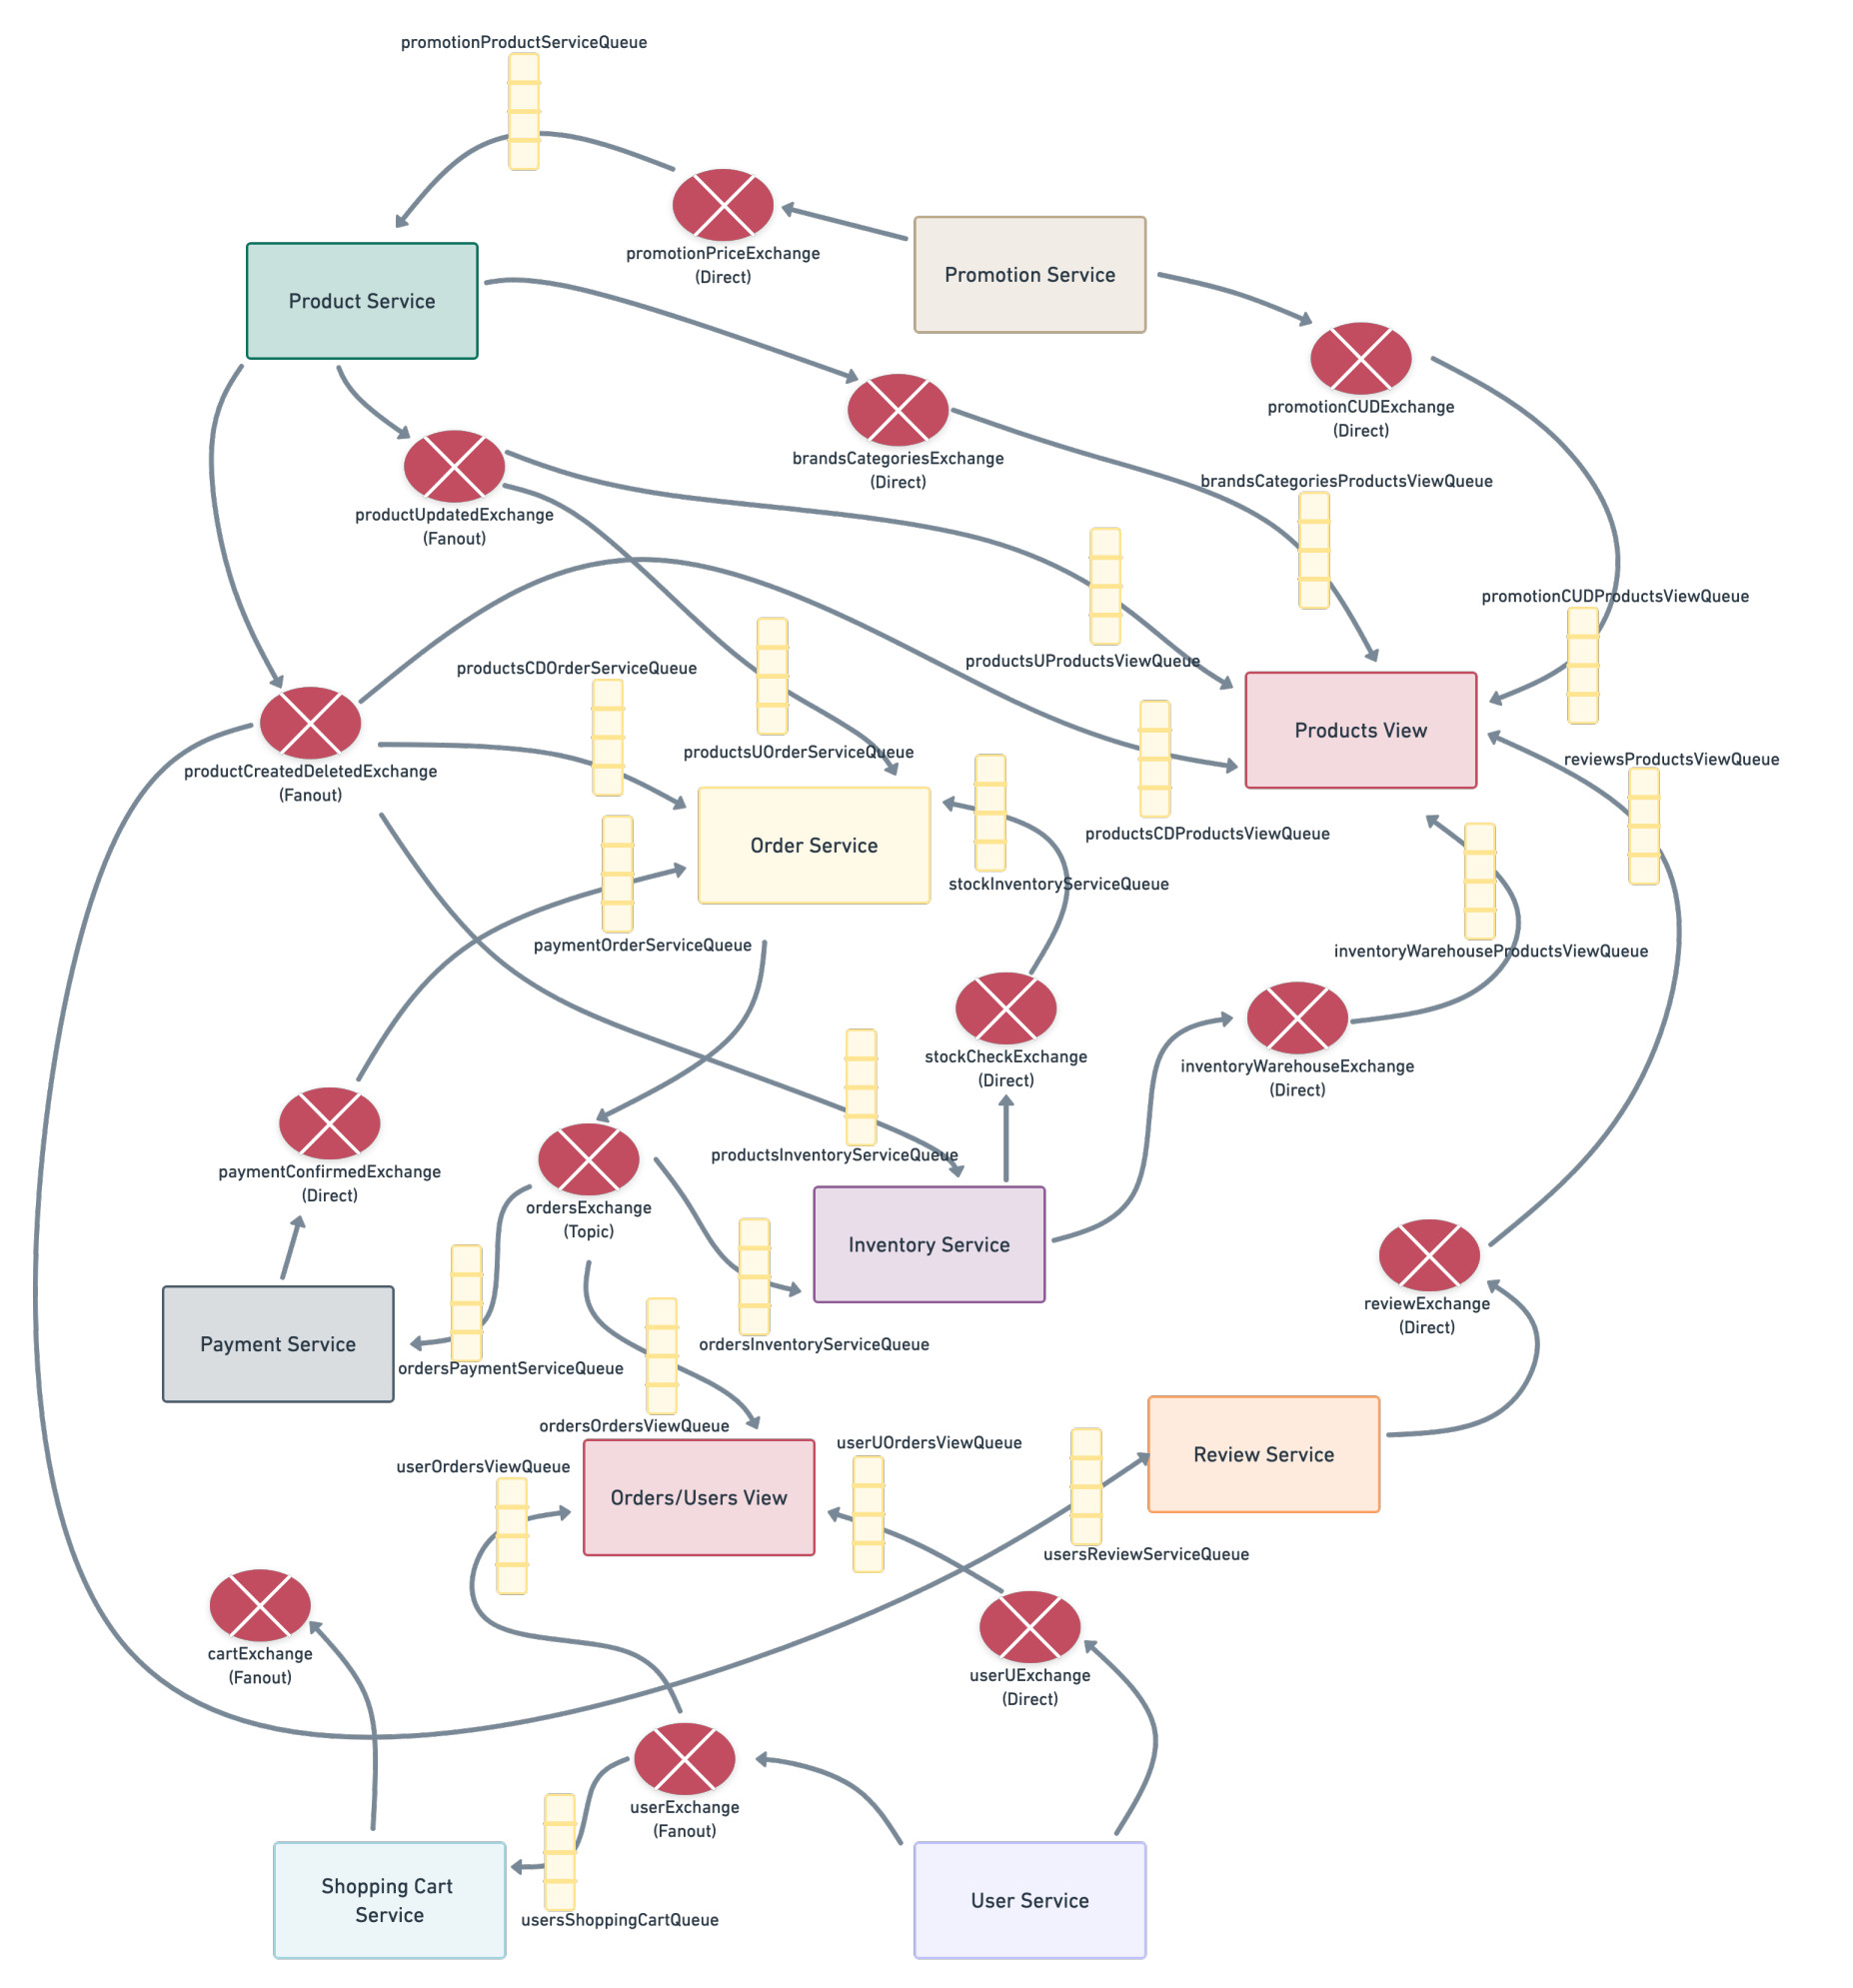
Regarding the communication infrastructure, the defined queues and exchanges are represented in the following chart.
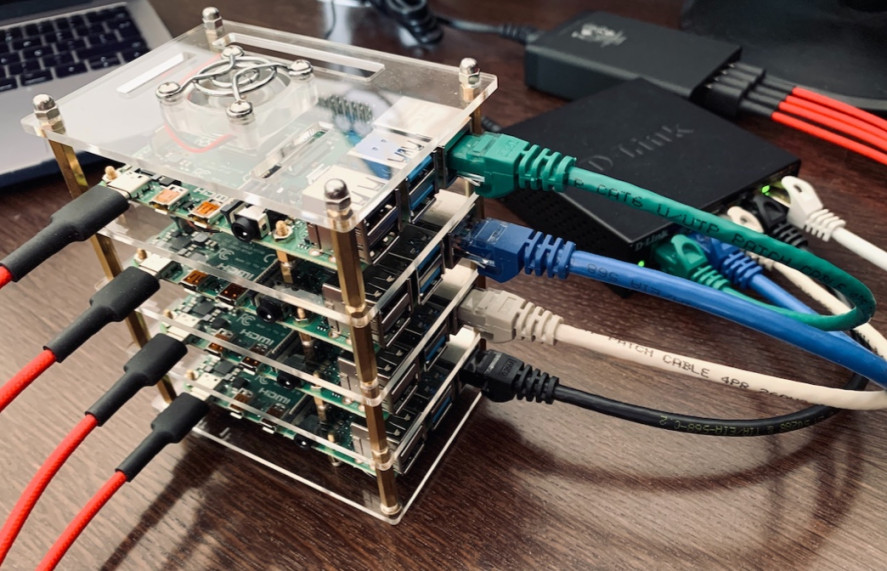
This platform was built for a Docker Swarm cluster composed of Raspberry pi 4 single-board computers, which features a special type of processor architecture. This means that the built docker images (available in Docker Hub) are not compatible with the typical AMD64 architectures.
In the context of a cluster of Raspberry Pi, once a swarm cluster is created and this repository is cloned run these commands inside this repository's folder on the master node to deploy and initialize each of the stacks:
docker stack deploy --compose-file main-app-compose.yml gama
docker stack deploy --compose-file monitoring-compose.yml monitoring
docker stack deploy --compose-file tracing-logging-compose.yml logging
In case you want to use your own database settings change the src/main/resources/application.properties file in each service and then build it with:
mvn clean package -DskipTests
docker build -t <image-name>
The <image-name> should replace the image name present in the main-app-compose.yml of the corresponding service. Then you can deploy the main application stack
using docker stack deploy --compose-file main-app-compose.yml gama.
The collection of the available endpoints realted to the business operations is available here: link.
All the business logic-related requests go through the API Gateway component which is reachable through any of the nodes that compsoe the cluster.
The services related to observability that offer a visual interface can be directly accessed:
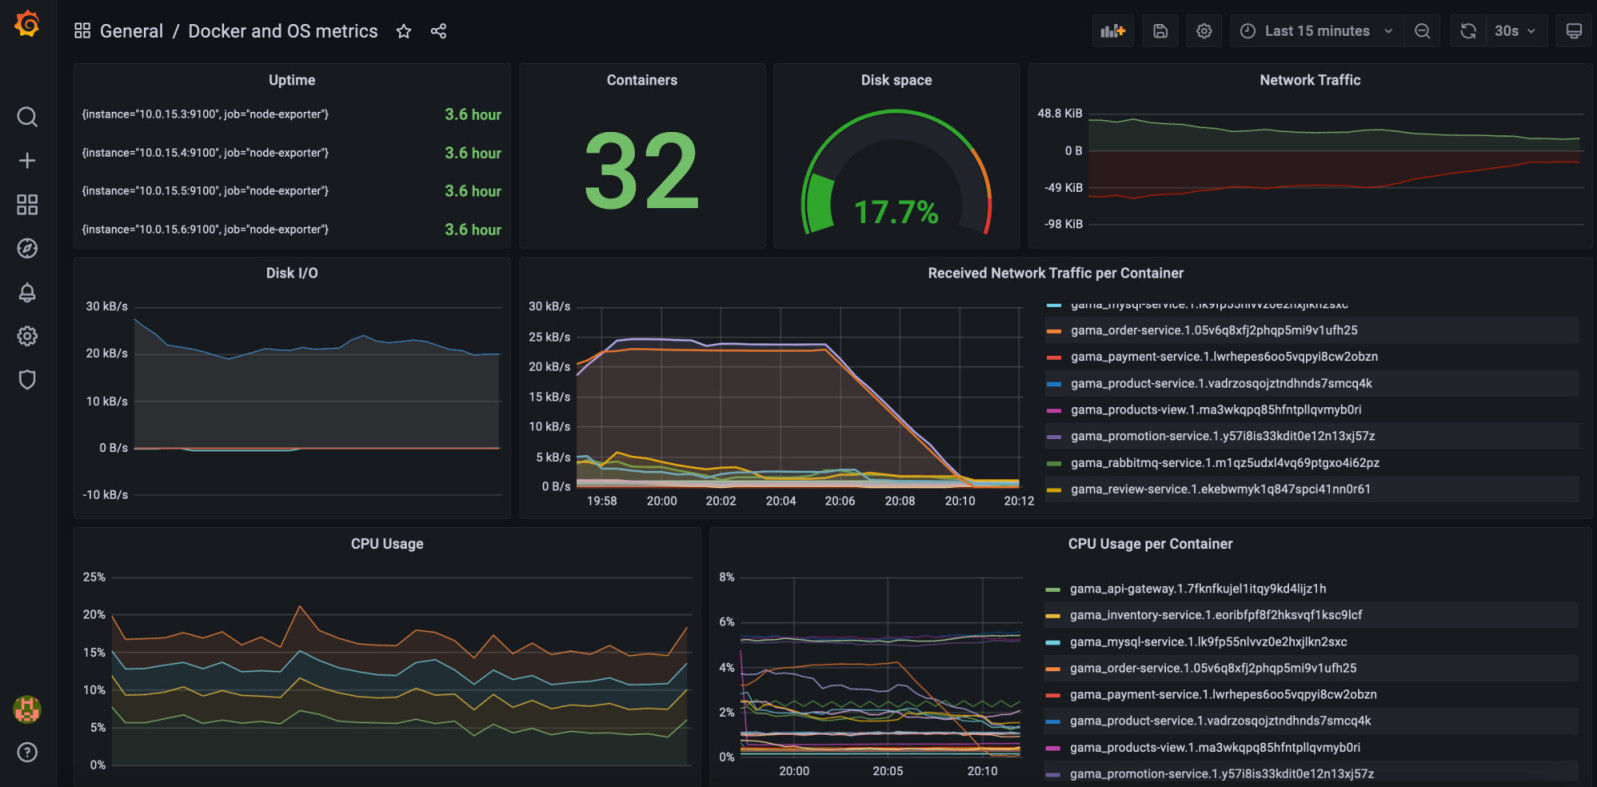
It is possible to monitor the several services distributed across the nodes through the Grafana dashboard. The metrics collected from Prometehus provide information related to CPU, memory, network usage and much more. The dashboard is accessible through port :3000.
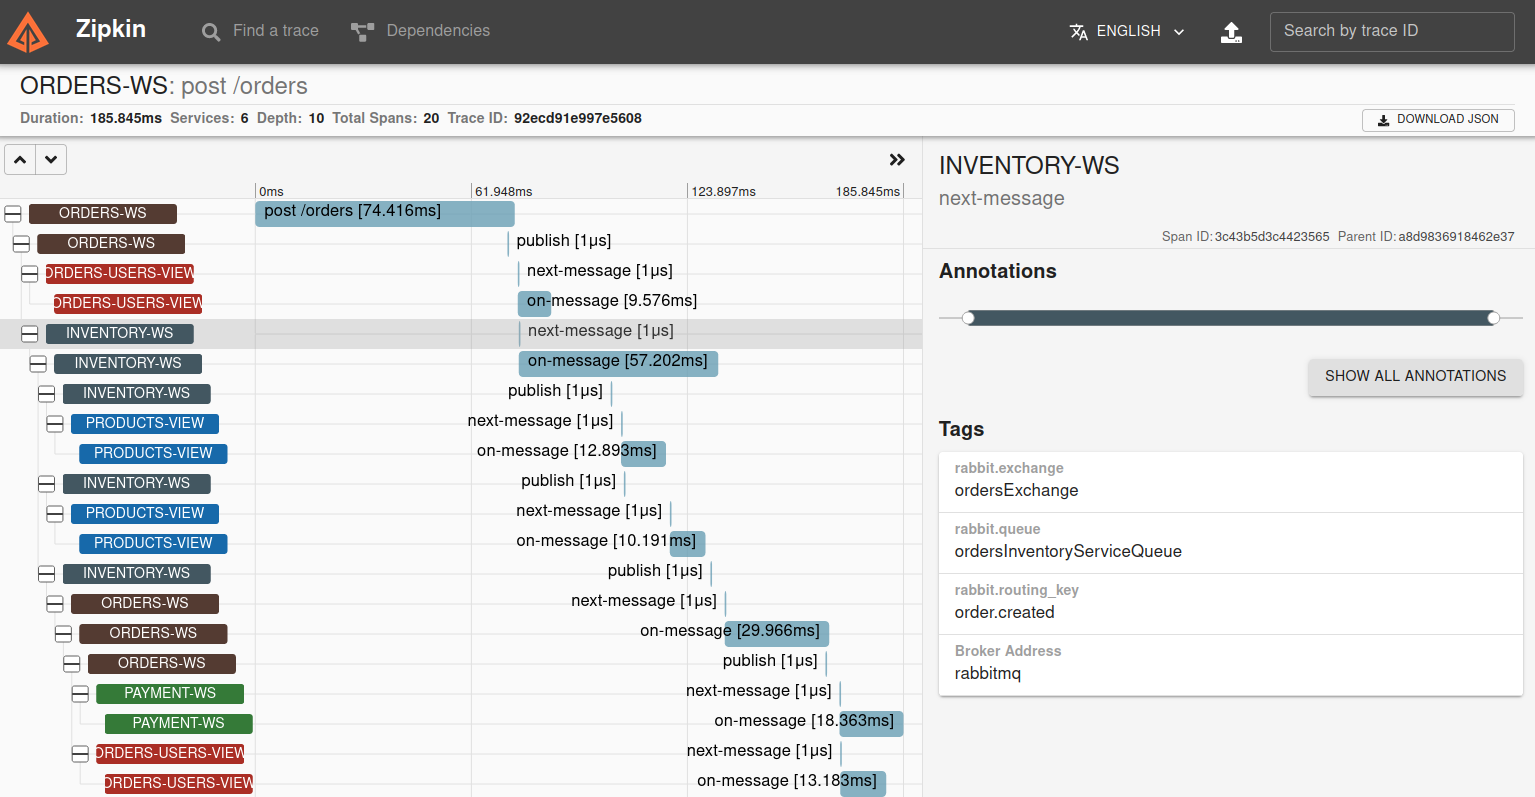
In order to aggregate the tracing data from all services in one same place for an overall visualization, Zipkin was used, which manages the collected data and provides a search interface. The outputs from service calls, after Spring Sleuth adds the necessary metadata, are sent over to the Zipkin server via HTTP. Inside Zipkin's UI it is possible to visualize the several spanned components and extra metrics such as the time spent in each service, which could be useful to identify potential performance bottlenecks. The visual interface is accessible from any of the nodes through port :9411.
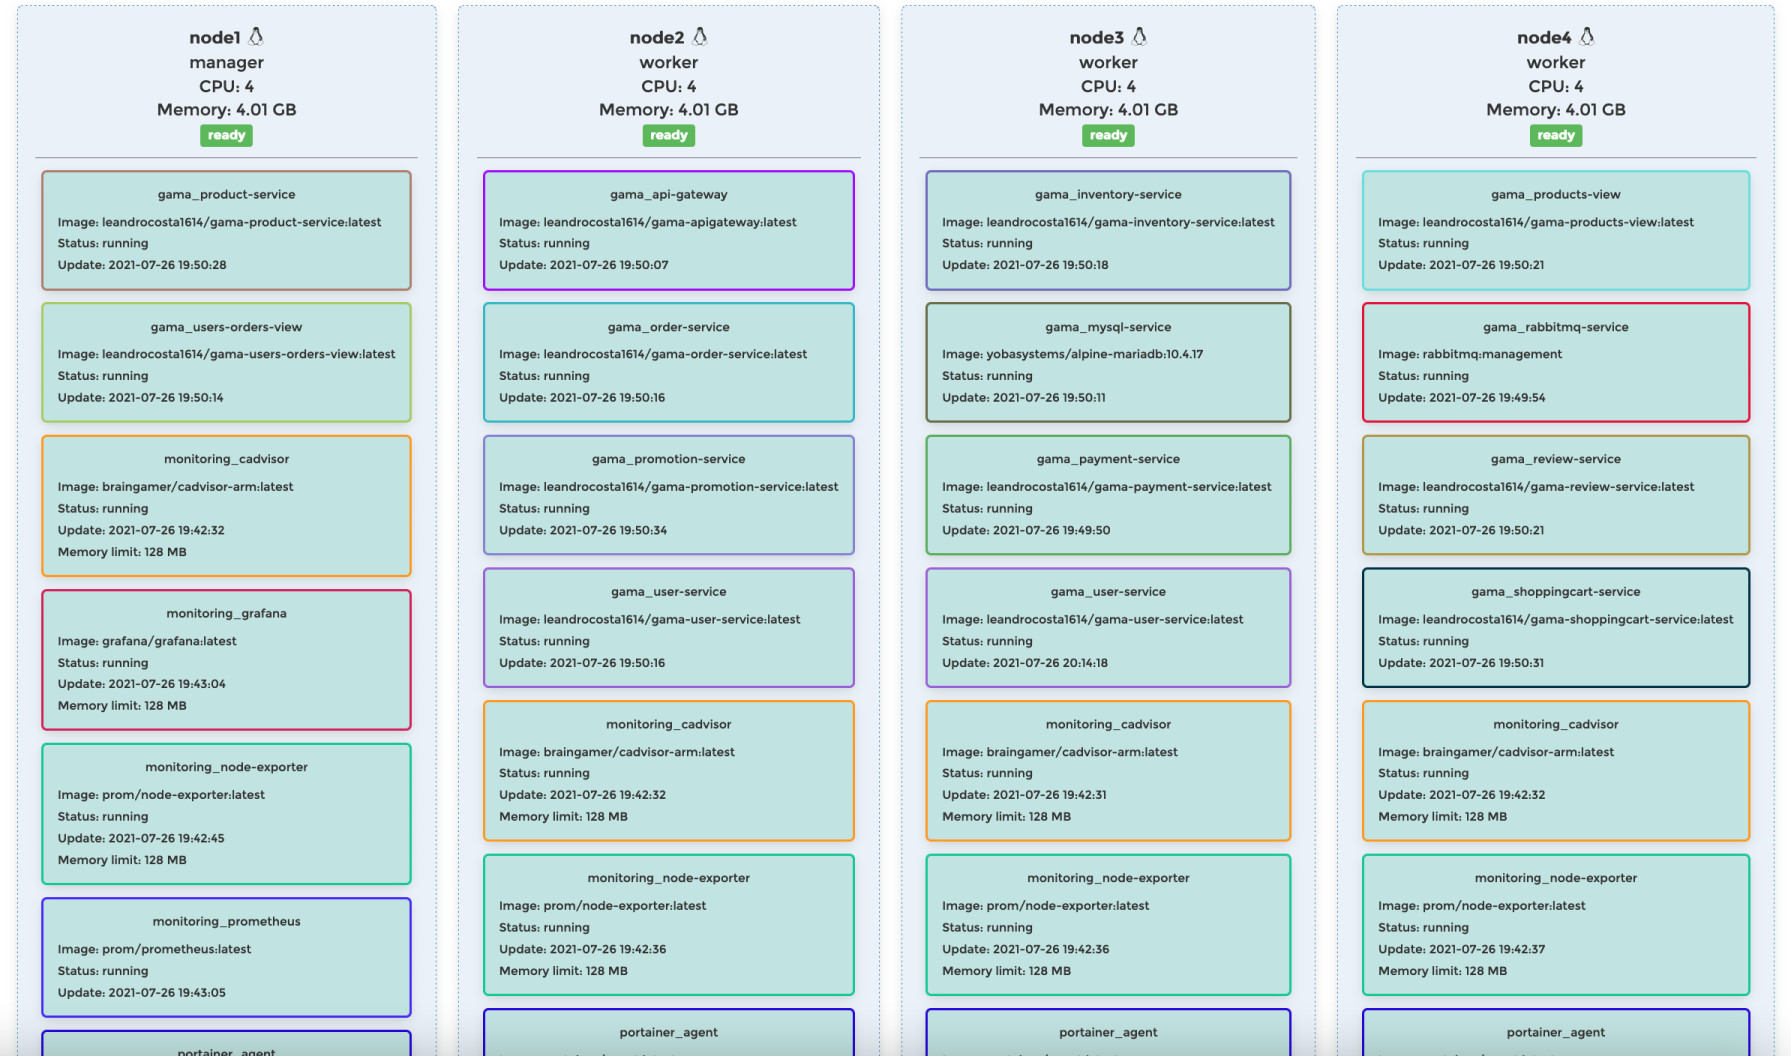
Portain porvides a graphical overview of the running tasks and how they are distributed across the physical instances at a given time. Through the graphical interface it is possible to have a general overview of the running cluster, start and stop containers, check the running instances and its distribution and even scale them. This service is accessible through port :9000
