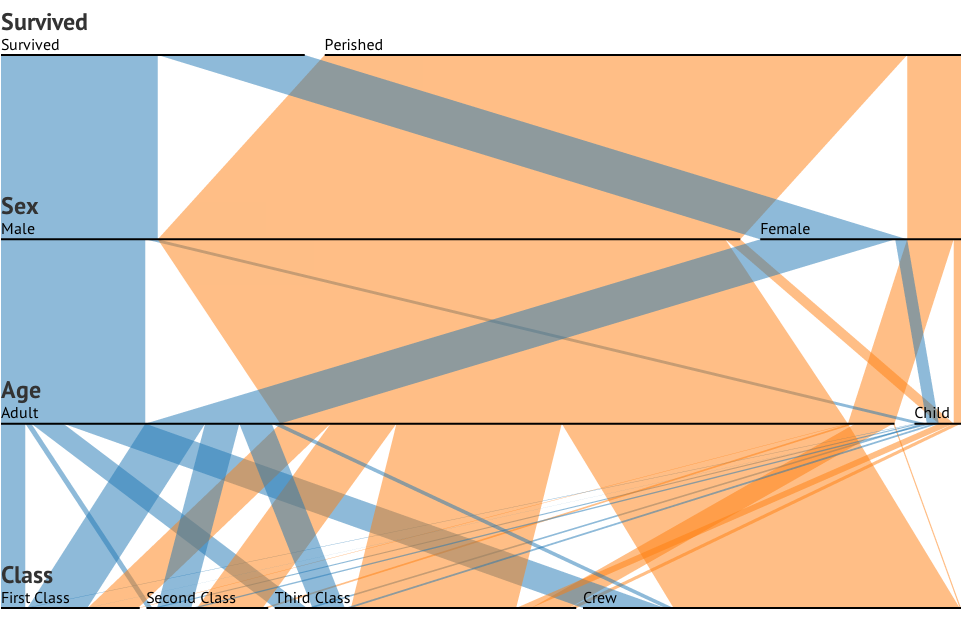
An interactive parallel sets visualisation for D3.js.
Example: http://www.jasondavies.com/parallel-sets/.
Functionality based on Parallel Sets by Robert Kosara and Caroline Ziemkiewicz.
# d3.parsets()
Creates a new parallel sets chart with default settings: dimensions are automatically detected and the size is 960×600. The chart is a function that can be called on any D3 selection that has data bound to it. This function can be configured as described below.
# parsets.dimensions(dimensions)
If dimensions is specified, sets the categorical dimensions to be visualised. If a function is specified, it is invoked for every element in the target selection and an array of dimension names is expected in return. If an array is specified, it should be an array of dimension names (object keys).
If dimensions is not specified, returns the current dimensions.
# parsets.value(value)
Specifies the value accessor. If value is not specified, returns the current value accessor. The default accessor simply returns 1 for each input data element i.e. the absolute frequency count. This value is used to set the width of the horizontal bars and connecting ribbons in proportion to the value.
If the input data is a pivot table, you’ll want to set this to return the aggregate sum for each input data element. You could also use an arbitrary numerical measure instead of frequency if appropriate.
# parsets.width(width)
Specifies the chart width in pixels. If width is not specified, returns the current width, which defaults to 960.
# parsets.height(height)
Specifies the chart height in pixels. If height is not specified, returns the current height, which defaults to 600.
If a negative height is specified, this causes the dimensions to be reversed vertically, and you need to set the appropriate translate transform in the chart’s parent <g> element.
# parsets.spacing(spacing)
Specifies the total amount of spacing in pixels to be divided between the horizontal category bars. If spacing is not specified, returns the current spacing, which defaults to 20.
# parsets.tension(tension)
Specifies the tension for the ribbon curves. This should be a value between 0 and 1 inclusive. If tension is not specified, returns the current tension, which defaults to 1 (straight lines).
# parsets.duration(duration)
Specifies the duration for the animated transitions in milliseconds. If duration is not specified, returns the current duration, which defaults to 500.
# parsets.dimensionFormat(dimensionFormat)
Specifies a formatting function for the dimension name. If dimensionFormat is not specified, returns the current formatting function, which defaults to String.
# parsets.tooltip(tooltip)
Specifies a formatting function for the ribbon tooltip. If tooltip is not specified, returns the current formatting function, which defaults to:
function(d) {
  var count = d.count,
      path = [];
  while (d.parent) {
    if (d.name) path.unshift(d.name);
    d = d.parent;
  }
  return path.join(" → ") + "<br>" + comma(count) + " (" + percent(count / d.count) + ")";
}
# parsets.categoryTooltip(categoryTooltip)
Specifies a formatting function for the category tooltip. If categoryTooltip is not specified, returns the current formatting function, which defaults to:
function(d) {
  return d.name + "<br>" + comma(d.count) + " (" + percent(d.count / d.dimension.count) + ")";
}
# parsets.on(type, listener)
Registers the specified listener to receive events of the specified type from the chart. Currently, this includes "sortDimensions" and "sortCategories", which are fired when dimensions or categories are reordered.
