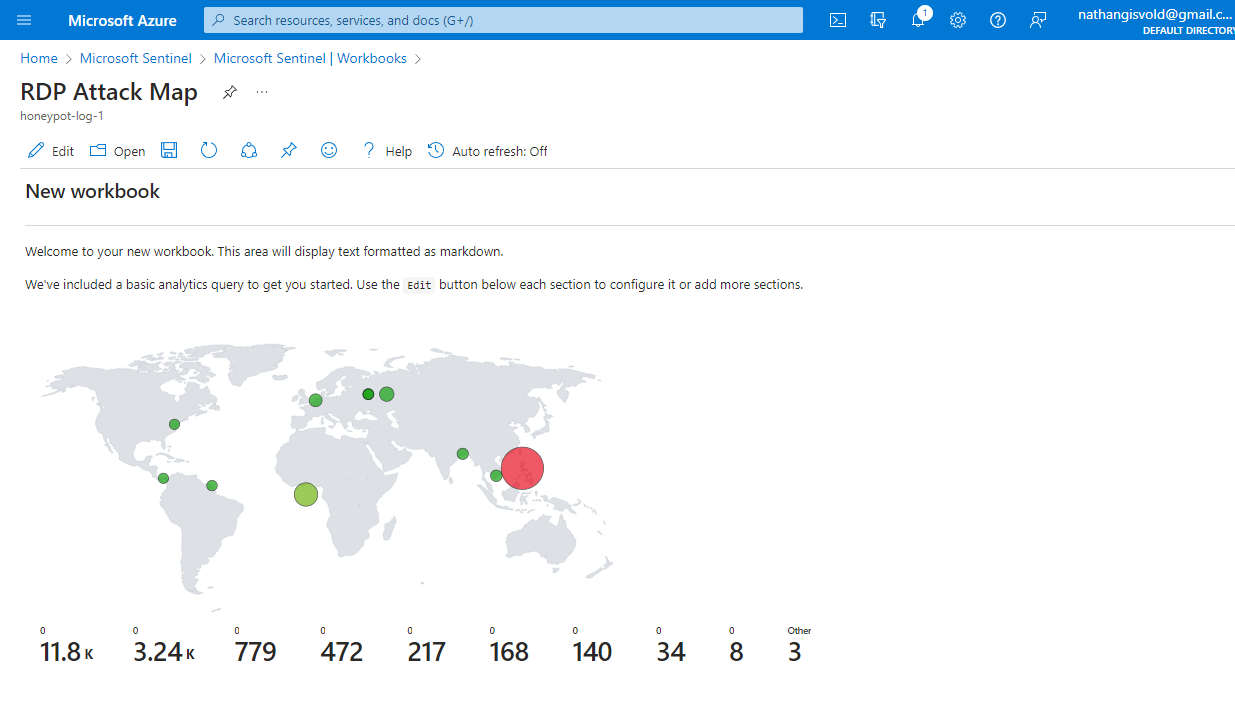
Set up Azure Sentinel (SIEM) to actively monitor a virtual machine honeypot, capturing live RDP Brute Force attack data from global sources. This project leverages a custom PowerShell script to fetch the geo-location of attackers and dynamically plots them on the Azure Sentinel Map for real-time threat visualization.
-
Initialize VM: Begin by configuring the fundamental settings of the VM Windows 10/11 Image.
-
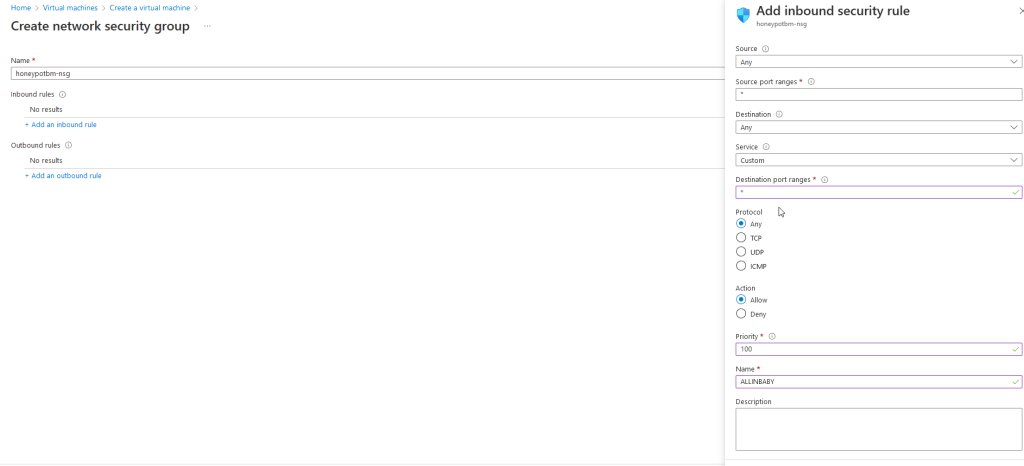
Intentionally Vulnerable Configuration: In a deliberate deviation from best cybersecurity practices, configure the VM to be as exposed as possible for the purpose of this experiment. This involves:
- Opening the network firewall to accept all incoming connections.
- Disabling the Windows VM Defender Firewall.
*Warning: This atypical setup is intentionally designed to test the capabilities of Azure Sentinel SIEM and should not be replicated for production or sensitive environments.
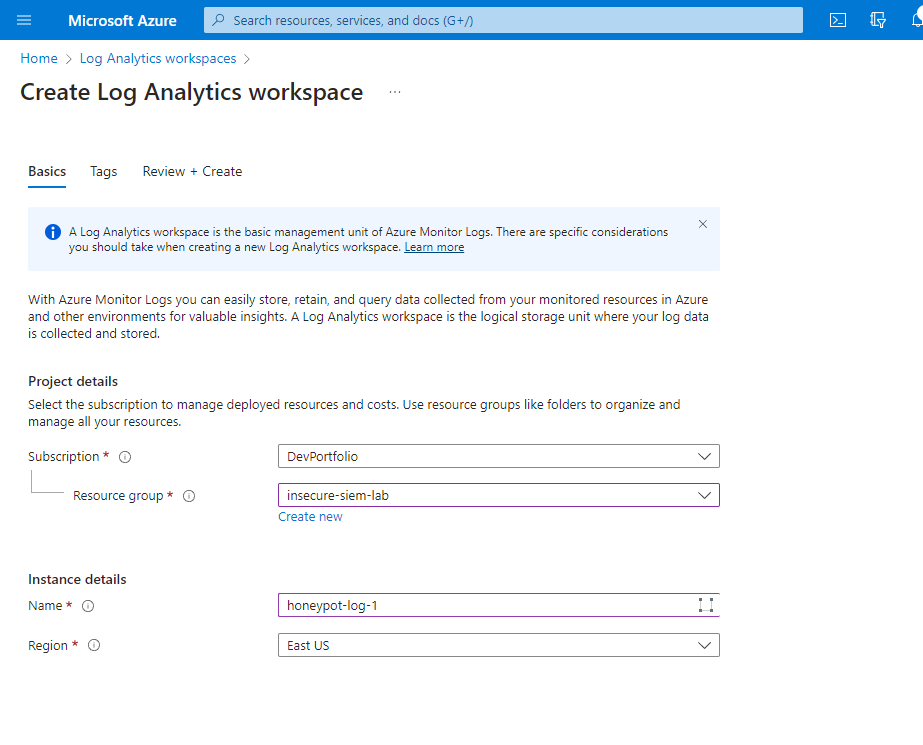
- Establish a Log Analytics Workspace: Begin by creating a Log Analytics Workspace in Azure. This workspace will be crucial for ingesting logs using Sentinel.
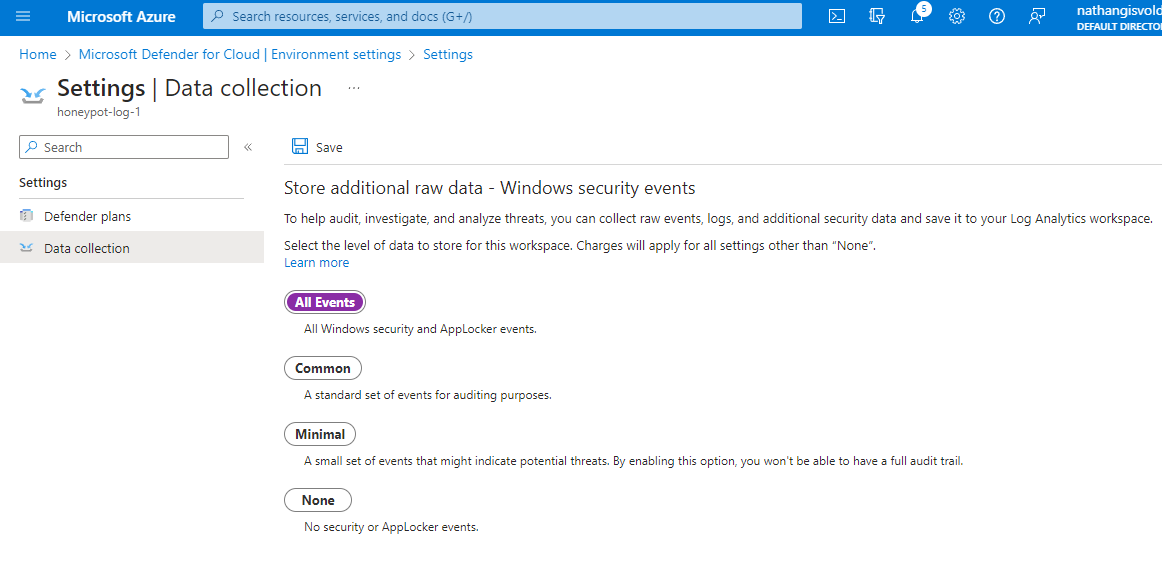
- Configure Microsoft Defender for Cloud:
- Navigate to Microsoft Defender for Cloud within Azure.
- Access the Environment Settings and ensure that only the "Servers" option is enabled.
- Proceed to the Data Collection section. Here, select "All Events" specific to the vulnerable VM we configured earlier.
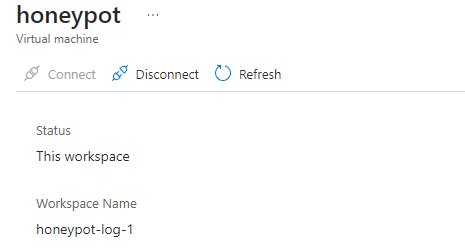
- Connect the Data Log to the Workspace.
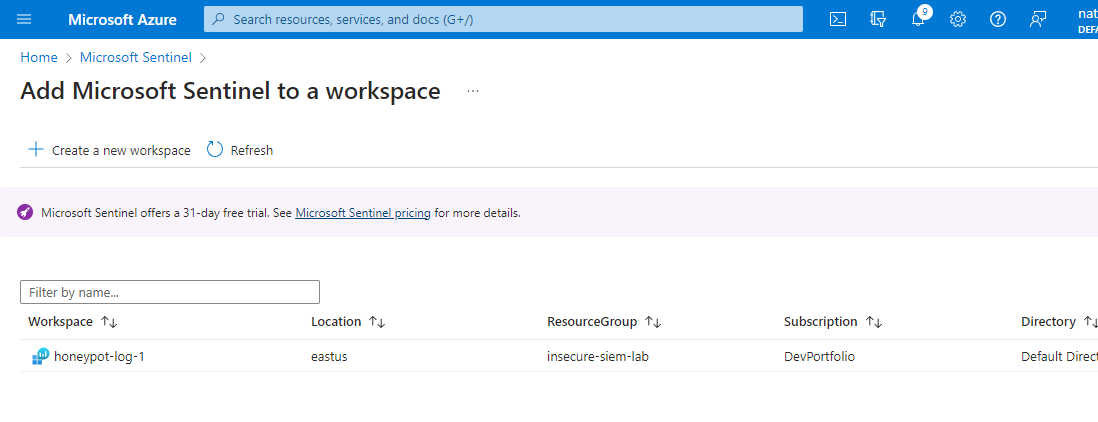
- Add Azure Sentinel to the Workspace:
-
Navigate to your previously created Log Analytics Workspace in Azure.
-
From within the workspace, select Azure Sentinel.
-
Click on the Add button to integrate Azure Sentinel with the workspace, enabling it to ingest and analyze the collected data.
- Simulate a Failed RDP Logon:
- Log into the configured VM.
- Intentionally use an incorrect password for login. This will generate a failed RDP logon event that will appear in the Windows Event Viewer's Security Logs.
- Install and Configure the PowerShell Script:
-
Download and use the provided PowerShell script from this repository. This script is designed to extract information from the Windows Event Log related to failed RDP attacks.
-
Additionally, the script interfaces with a third-party API to retrieve geographical information pertaining to the attacker's location.
- API Key Acquisition & Configuration:
- Obtain an API key for the IP address-to-geolocation service from IPGeolocation.
- IP Address to Geolocation API - https://ipgeolocation.io
- Configure the PowerShell script with the obtained API key, which allows Azure Sentinel to visualize the source locations of the attacks.
- Execute the PowerShell Script:
- Run the Security_Log_Exporter.ps1 script.
- After execution, a log file will be generated and stored at C:\ProgramData
- Log File Management:
- Copy the generated log file and create a new one.
- Navigate to the Log Analytics workspace in Azure.
- Upload the new log file to the workspace and designate it as a custom log.
- Data Extraction:
- Once you've added the custom log to Azure, you'll now need to extract pertinent data like the location and IP.
- To achieve this, navigate to the workbook in Azure Sentinel where you intend to visualize the map.
- Insert the Extraction Script:
- Paste the following Kusto Query Language (KQL) script to extract and structure the desired data from the logs:
FAILED_RDP_WITH_GEO_CL
| extend username = extract(@"username:([^,]+)", 1, RawData),
         timestamp = extract(@"timestamp:([^,]+)", 1, RawData),
         latitude = extract(@"latitude:([^,]+)", 1, RawData),
         longitude = extract(@"longitude:([^,]+)", 1, RawData),
         sourcehost = extract(@"sourcehost:([^,]+)", 1, RawData),
         state = extract(@"state:([^,]+)", 1, RawData),
         label = extract(@"label:([^,]+)", 1, RawData),
         destination = extract(@"destinationhost:([^,]+)", 1, RawData),
         country = extract(@"country:([^,]+)", 1, RawData)
| where destination != "samplehost"
| where sourcehost != ""
| summarize event_count=count() by latitude, longitude, sourcehost, label, destination, country
- Visualization:
- After executing the script, Azure Sentinel's workbook will process the data and plot it on a map.
- You can now view and analyze the geographically pinpointed RDP attack attempts directly within Sentinel's visualization tools.
