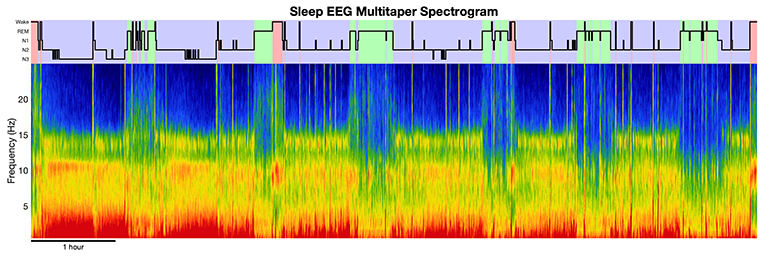
A powerful tool for analyzing sleep EEG oscillatory structure has been spectral analysis, a quantitative approach for describing a waveform signal in terms of its components at different frequencies. A powerful form of spectral estimation is the multitaper method, which provides a high-resolution, low-noise, time-frequency representation of the sleep EEG.
We have created toolboxes in MATLAB, python, and R for computing multitaper spectrograms.
Click here to view the toolbox code repository on Github
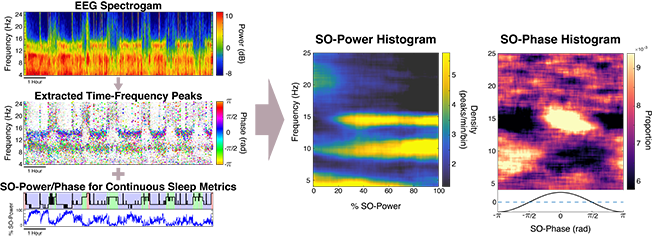
We have developed a new approach to creating individualized electroencephalogram (EEG) fingerprints of brain activity during sleep, which can be used to identify biomarkers of neurological health and disease. We first identify tens of thousands of short, spindle-like EEG waveforms called time-frequency peaks (TF-peaks) across a night of sleep. Then, we create visual summaries of brain state by characterizing the activity of TF-peaks as a function of sleep depth and also cortical timing, called SO-power and SO-phase histograms. These summaries, like fingerprints, appear to be unique to individuals yet consistent night to night, providing a highly informative new visualization technique and powerful basis for understanding neurological health and disease.
We have developed DYNAM-O, an open source toolbox and tutorial to create
slow-oscillation power (SO-power) and phase (SO-phase) histograms from
the extracted TF-peak data.
Click here to view the toolbox code repository on Github
Obstructive sleep apnea (OSA), in which breathing is reduced or ceased during sleep, affects at least 10% of the population and is associated with numerous comorbidities. Current clinical diagnostic approaches characterize severity and treatment eligibility using the average respiratory event rate over total sleep time (apnea hypopnea index, or AHI). This approach, however, does not characterize the time-varying and dynamic properties of respiratory events that can change as a function of body position, sleep stage, and previous respiratory event activity. Here, we develop a statistical model framework based on point process theory that characterizes the relative influences of all these factors on the moment-to-moment rate of event occurrence.
We provide a code toolbox and tutorial to walk through the framework, from constructing model input to model fitting, as well as the code to visualize the model.
Click here to view the toolbox code repository on Github
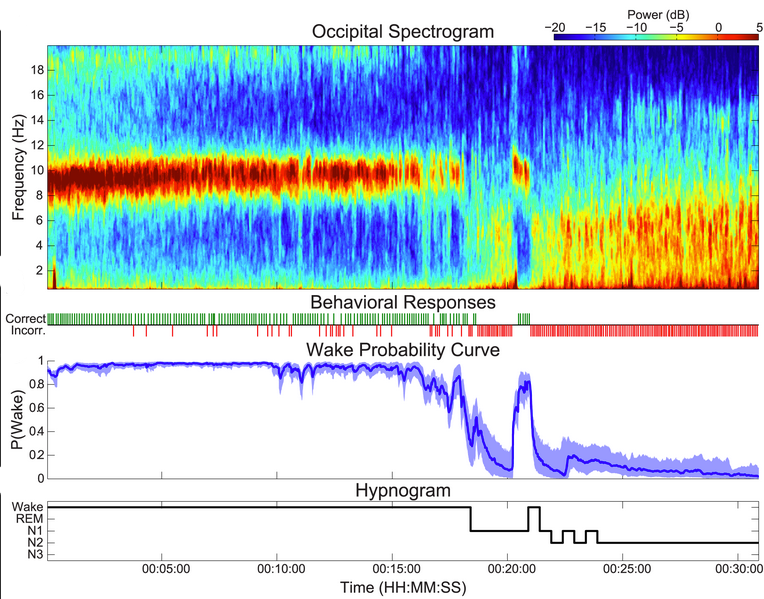
How can we tell when someone has fallen asleep? Understanding the way we fall asleep is an important problem in sleep medicine, since sleep disorders can disrupt the process of falling asleep. In the case of insomnia, subjects may fall asleep too slowly, whereas during sleep deprivation or narcolepsy, subjects fall asleep too quickly. Current methods for tracking the wake/sleep transition are time-consuming, subjective, and simplify the sleep onset process in a way that severely limits the accuracy, power, and scope of any resulting clinical metrics. We have developed a new physiologically principled method that dynamically combines information from brainwaves, muscle activity, and a novel minimally-disruptive behavioral task, to automatically create a continuous dynamic characterization of a person’s state of wakefulness.
We provide a code toolbox and video tutorial to explain the general concepts and results from the paper.
Click here to view the toolbox code repository on Github
Transient Oscillation Dynamics During Sleep Provide a Robust Basis for Electroencephalographic Phenotyping and Biomarker Identification
Currently, the AHI (apnea-hypopnea index: average number of nightly apnea-related breathing events per hour) is treated as a single number that definitively describes the patient’s condition. However, differences in sleep quality across nights, changes in sleep and breathing patterns within a single night, and variability from the limited amount of data collected in a single sleep study can potentially cause a great deal of variability associated with this measurement. Slight alteration in AHI value could mean that an AHI will be on one side of the threshold in one sleep study and the other side of the threshold on a subsequent sleep study, which can be the difference between eligibility and denial of treatment. It is therefore important to understand the uncertainty of the AHI statistic to determine the degree to which it is possible to be confidence in a given diagnosis.
To address these problems, we have developed two methods of estimating a confidence interval on the AHI based on what type of data are available.
Click here to use this tool.
European Data Format (EDF) is one of the primary ways polysomnography and EEG data are stored. De-identification of EDF files is a necessary step for safe sharing of data, removing any identifying information from the file headers. Often EDF de-identification tools are part of some larger toolbox or software package, making distribution to clinical sites and personnel more difficult.
Here we provide standalone GUI-based programs for PC, Mac, and Linux as well as functional source code in MATLAB and python to facilitate de-identification of EDF files.
Click here to use this tool.


