-
Notifications
You must be signed in to change notification settings - Fork 16
Workflow Horvath lab
The biological motivation for morphological profiling in Horvath group at the Institute for Molecular Medicine Finland (FIMM), University of Helsinki, and at the Hungarian Academy of Sciences is to screen drugs for patient-derived cells and find the most suitable drug or a combination of drugs for individual patient. The collection including over 500 approved and on-trial drugs have been tested for multiple different types of cancers for patient-derived cells and cell lines.
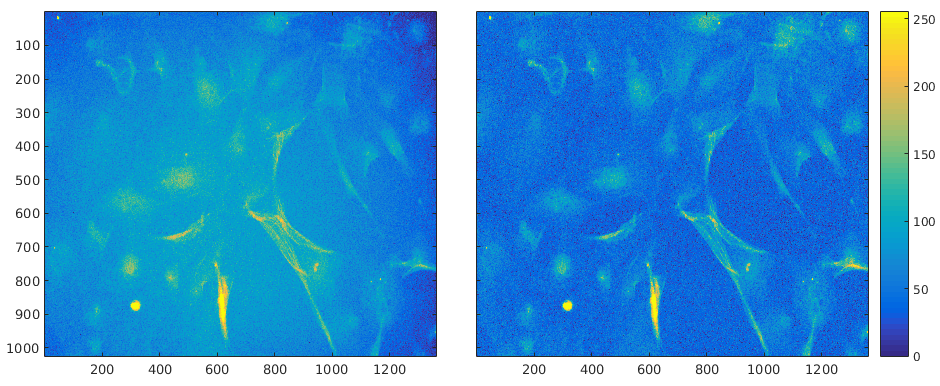
Non-uniform illumination is corrected using CIDRE method (Smith et al, 2015) as a preprocessing step for image analysis. CIDRE creates illumination model for each channel using all recorded images of the channel in a plate, and uses the model with energy minimization to correct illumination (Fig. 1).

Figure 1. Left raw image, right corrected image. Intensities have been scaled for better visual appearance.
Mostly CellProfiler and some algorithms in Matlab are used to segment nuclei and cell cytoplasm or regions surrounding the nuclei. From the segmented regions we measure various intensity, shape and texture features for our phenotype studies as well as for studies related to individual cells.
- We visualize the number of segmented cells in every well of all plates to identify possibly falsely segmented wells. Often this can be seen as too many objects.
- In case segmentation was unable to detect cells at all or missed many cells due to bad focus level in imaging, we are visually able to see this when we study the effects of a drug in increasing concentrations. The effect should be systematic. We also automatically detect these strong local minima and maxima which are visually checked.
We use Advanced Cell Classifier (http://www.cellclassifier.org) (Horvath et al., 2011) for annotation of a training set of cells and then to classify all segmented cells of the experiment (Fig. 2). Advanced Cell Classifier is software for supervised machine learning with approximately 20 classifiers and many tools to aid teaching of the model and to find new phenotypes.

Figure 2. Classifying cells with Advanced Cell Classifier.
- Features are normalized based on the mean of all DMSO wells. This mean value is also used as a first point in our drug profiles.
- Based on our earlier experiments with non imaging-based assays we leave the first (1.) and the last (24.) column empty in our current 384 well plate set design.
- We visualize cell counts in heatmaps to detect systematic effects on plates and between plates.
- We visualize cell counts in negative control, positive control and in wells without DMSO to detect variation between plates.
- We calculate Z-factor for each plate.
Paper about quality control and plate normalization at FIMM for viability assays (Mpindi et al., 2015).
- In case of smaller experiments we do not apply feature reduction (~200-500 features). For bigger dataset we use PCA or weka's InfoGain package.
- We study mean + std or median values of all cells in a well.
- After phenotypic classification using ACC we do the same for all cells in each phenotype.
- In our recent studies we have used cosine similarity to measure similarity between profiles. We are currently doing comparative studies to find most suitable metric for our data.
- We have visualization tools to help biologists to go through the results and check hit drugs.
- We use hierarchical clustering to find groups of drugs that produce similar effect on cells.
- Horvath, P., Wild, T., Kutay, U., Csucs, G. (2011). Machine learning improves the precision and robustness of high-content screens, using non-linear multi-parametric methods to analyze screening results. Journal of Biomolecular Screening, 16(9), 1059-1067.https://dx.doi.org/10.1177/1087057111414878
- Mpindi, J.-P., Potdar, S., Bychkov, D., Saarela, J., Saeed, K., Wennerberg, K., Aittokallio, T., Östling, P., Kallioniemi, O. (2015). Impact of normalization methods on high-throughput screening data with high hit-rates and drug testing with dose-response data. Bioinformatics.https://dx.doi.org/10.1093/bioinformatics/btv455
- Smith, K., Li, Y., Piccinini, F., Csucs, G., Balazs, C., Bevilacqua, A., & Horvath, P. (2015). CIDRE: an illumination-correction method for optical microscopy. Nature methods, 12(5), 404-406. https://dx.doi.org/10.1038/nmeth.3323
Implementing profiling workflows
- IA-Lab (AstraZeneca Cambridge)
- Bakal (Inst. Cancer Research London)
- Borgeson (Recursion)
- Boutros (German Cancer Research Center)
- Carpenter (Broad Imaging Platform)
- Carragher (U Edinburgh)
- Clemons (Broad Comp. Chem. Bio)
- de Boer (Maastricht U)
- Frey (U Toronto)
- Horvath (Hungarian Acad of Sciences)
- Huber (EMBL Heidelberg)
- Jaensch (Janssen)
- Jaffe (Broad Comp. Proteomics)
- Jones (Harvard)
- Linington (Simon Fraser U)
- Pelkmans (U Zurich)
- Qiu (Georgia Tech)
- Ross (Novartis High Throughput Biol.)
- Rees (Swansea U)
- Subramanian (Broad CMap)
- Sundaramurthy (Nat. Center for Biol. Sciences)